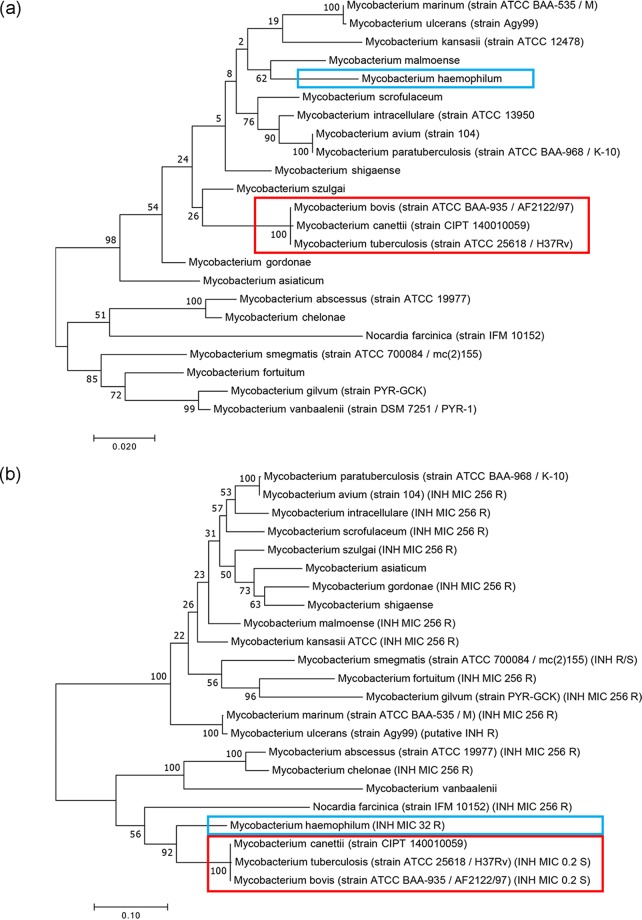
FIG 3.
Mycobacteria phylogenies analyzed with (a) RNA polymerase subunit B (RpoB) and (b) catalase-peroxidase (KatG) protein sequences. Note the high distance versus close proximity of the M. tuberculosis complex (red) from M. haemophilum (blue) in panel (a) versus (b), reflected in the relative INH sensitivity of the latter.

