FIG 2.
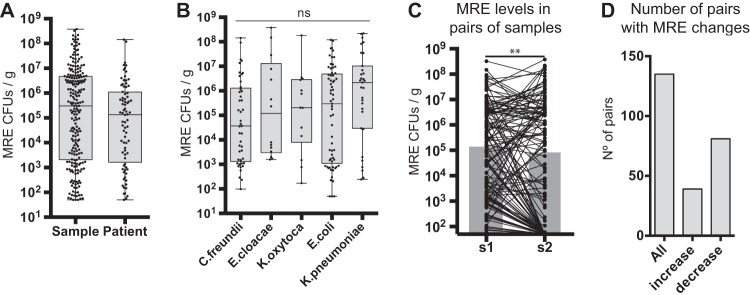
MRE fecal levels differ significantly between patients but also within a patient. (A) MRE levels identified in all colonized fecal samples included in the study (N = 221 samples) or the mean (obtained from log10 CFU data) of the MRE levels identified in colonized samples from each patient (N = 80 patients). Whiskers represent minimum and maximum values. Horizontal lines represent the medians and 25th to 75th percentiles. (B) MRE levels in fecal samples colonized exclusively with the indicated species (low-abundant species [N ≤ 5] are not included). No significant (ns) differences in MRE levels were detected between different species (Kruskal-Wallis test). N = 45 (C. freundii), 14 (E. cloacae), 13 (K. oxytoca), 65 (E. coli), and 31 (K. pneumoniae) samples. (C) Changes in MRE levels among 135 pairs of consecutive fecal samples (see Materials and Methods for definition) collected from 59 patients. The gray bars represent the medians of MRE levels. **, P < 0.01 by two-tailed paired Wilcoxon test. (D) Number of the total pairs of consecutive samples included in the study (all) and numbers of pairs of samples in which an increase in MRE levels (>1 log2 fold change [FC]; N = 39) or a decrease in MRE levels (<−1 log2 FC; N = 81) was detected.

