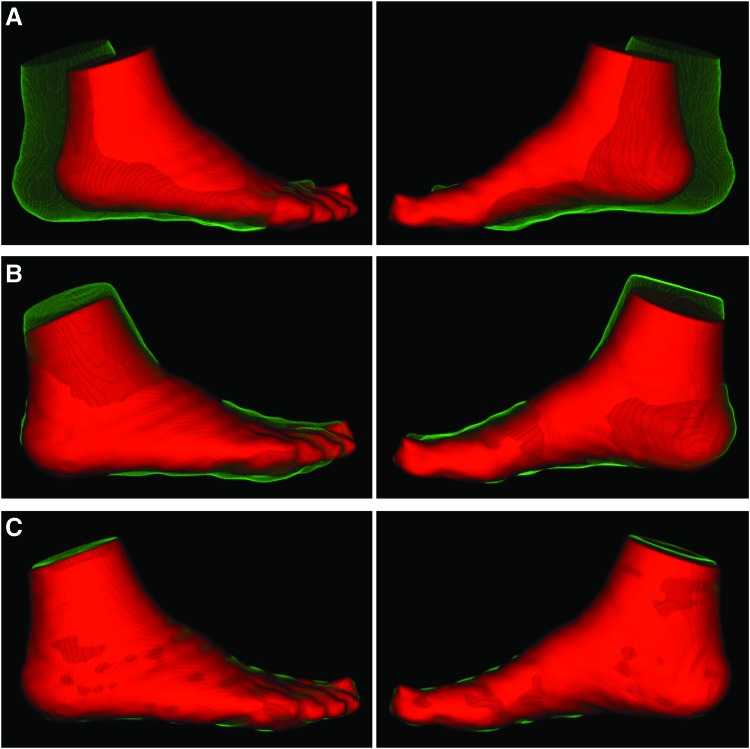
Figure 2.
Serial image registration of CT images for evaluating serial changes in angiosome foot perfusion. Lateral and medial views of volume rendered CT images are displayed for the (A) initial foot position at both study time points before image registration, (B) following global rigid registration, and (C) after nonrigid registration. The red images represent the foot position at the time of patient's pre-revascularization study visit, while the green images represent the change in foot position at the time of patient's follow-up post-revascularization visit. Color images are available online.

