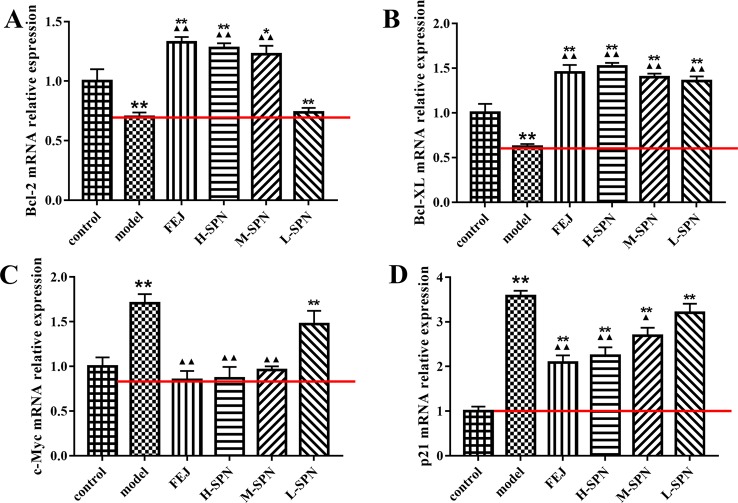
Figure 7.
The mRNA expression of (A) Bcl-2, (B) Bcl-XL, (C) c-Myc, and (D) p21 in control and model mice after treatment with saline solution (model), FEJ and different doses of SPN. Each value represents the mean ± SD (n = 10); *P < 0.05 and **P < 0.01, compared to the control group; ▲ P < 0.05 and ▲▲ P < 0.01, compared to the model group.

