FIGURE 4.
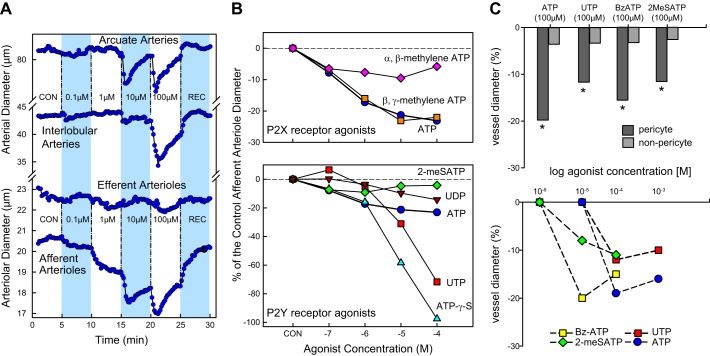
Renal microvascular responses to ATP or P2 receptor activation. A: changes in intrarenal microvessel diameter in response to exogenous ATP in blood-perfused rat juxtamedullary nephrons. Represented are arcuate arteries, interlobular arteries, and efferent and afferent arterioles. Exogenous ATP was applied from the adventitial surface via superfusion. Following a 5-min control period (CON), increasing concentrations of ATP from 0.1 to 100 μM were applied at 5-min intervals as indicated by the dashed lines and shaded bars. Each protocol ended with a 5-min recovery period (REC). [Modified from Inscho et al. (226).] B: sustained afferent arteriole responses to ATP and selected P2X and P2Y receptor agonists. Data are expressed as percentage of control diameter before agonist exposure. Top panel illustrates responses to P2X agonists, α,β-methylene ATP, and β,γ-methylene ATP compared with ATP. Bottom panel illustrates responses to P2Y agonists 2-methylthio-ATP (2-MeSATP), UDP, UTP, and ATP-γ-S compared with ATP. [Modified from Inscho et al. (223).] C: in situ effects of P2 receptor agonists on vasa recta diameter. P2 receptor agonists ATP, UTP, BzATP, and 2-MeSATP evoked a greater constriction of vasa recta at pericyte sites (dark gray bars) compared with non‐pericyte sites (light gray bars). *P < 0.01 vs. non-pericyte. Line graph shows concentration‐dependent effect of agonist‐evoked change in vasa recta diameter at pericyte sites for all P2 receptor agonists shown above. [Modified from Crawford et al. (110), with permission from John Wiley and Sons.]

