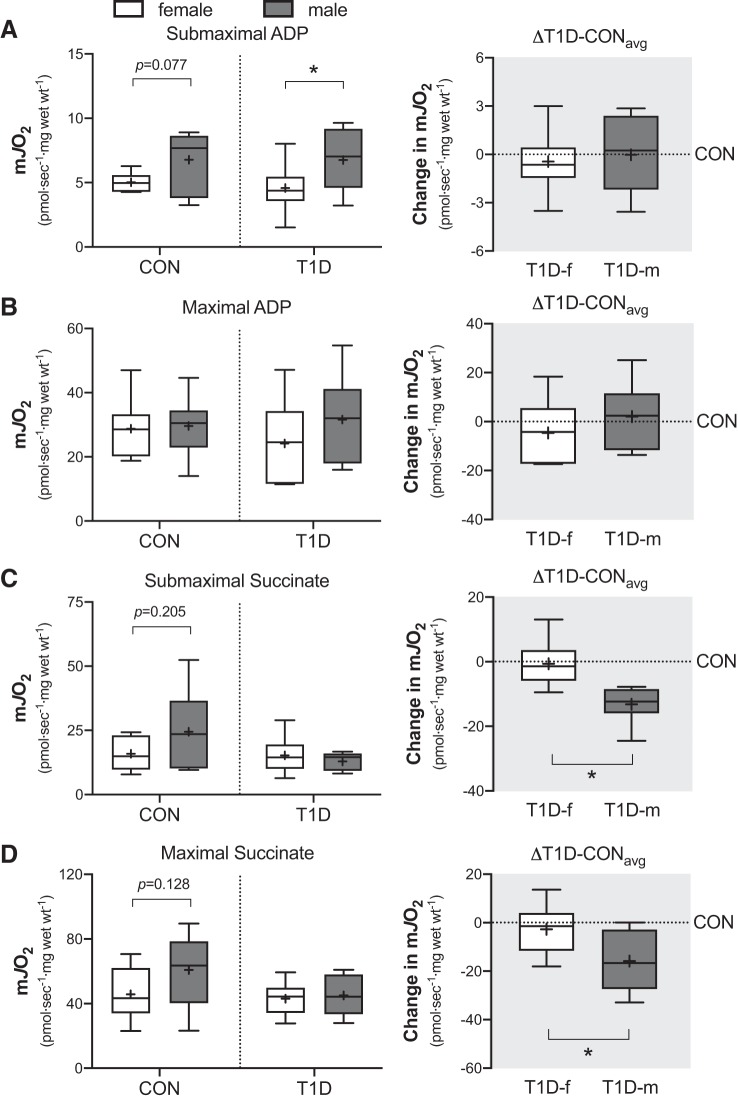
Fig. 1.
Mitochondrial ADP-stimulated respiration supported by pyruvate (5 mM) and malate (2 mM) in the presence of either submaximal (25 µM) ADP (A) or maximal (varied 6 to 18 mM) ADP (B) in skeletal muscle biopsies from control (CON) and type 1 diabetes (T1D) women and men. Right panel of (A) and (B) is the absolute change in ADP-stimulated respiration from each T1D participant relative to the average of their sex-matched control (ΔT1D-CONavg). In (C) and (D) is mitochondrial complex II respiration supported by ADP (5 mM), rotenone (0.5 µM), and in the presence of either submaximal (2 mM) succinate (C) or maximal (varied 22 to 30 mM) succinate (D). Right panel of (C) and (D) is the absolute change in complex II-supported respiration from each T1D participant relative to the average of their sex-matched control (△T1D-CONavg). Boxes represent the interquartile range, whiskers show the maximum and minimum, the horizontal line indicates the median and the cross indicates the mean. *P < 0.05 versus women. f, female; m, male; mJO2, mitochondrial oxygen flux; Wt, weight. n = 7–8 for CON women; n = 7 for CON men; n = 9–10 for T1D women; n = 7–8 for T1D men.

