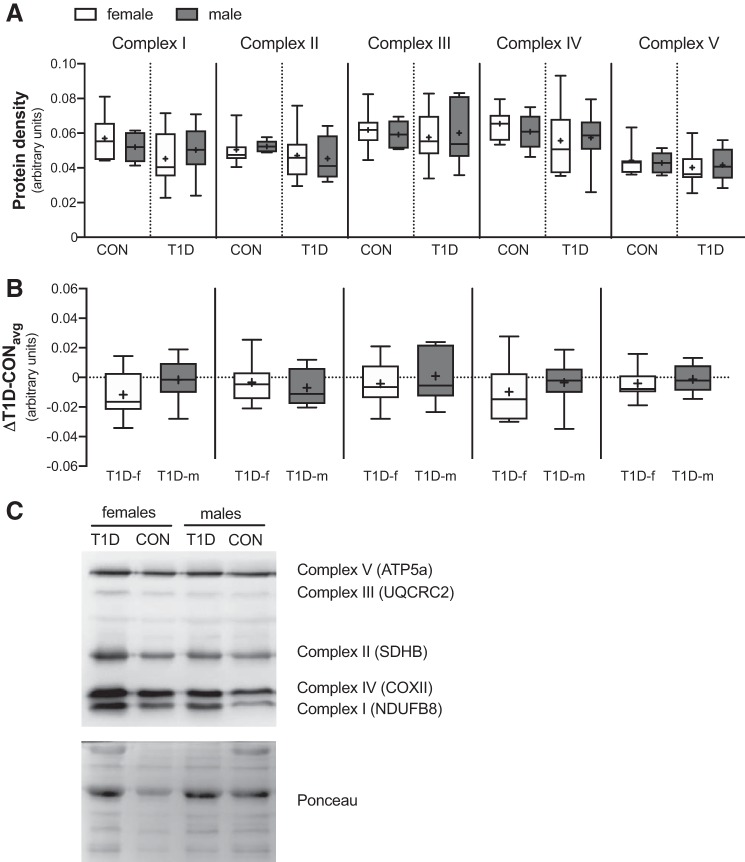
Fig. 4.
Skeletal muscle mitochondrial content in control (CON) and type 1 diabetes (T1D) women (f) and men (m). (A) Protein expression of the individual complexes of the electron transport chain (I through V) were individually quantified by densitometry. (B) Protein density absolute change from each T1D participant relative to the average of their sex-matched control (△T1D-CONavg). (C) Representative immunoblot of Complex I (~18 kDa), Complex II (~29 kDa), Complex III (~48 kDa), Complex IV (~22 kDa) and Complex V (~54 kDa) and Ponceau stain for loading control. Boxes represent the interquartile range, whiskers show the maximum and minimum, the horizontal line indicates the median and the cross indicates the mean. ATP5a, ATP synthase subunit alpha 5; COXII, cytochrome oxidase subunit II; NDUFB8, NADH:ubiquinone oxidoreductase subunit B8; SDHB, succinate dehydrogenase [ubiquinone] iron-sulfur subunit B; UQCRC2, ubiquinol-cytochrome c reductase core protein 2. n = 7 for CON women; n = 5 for CON men; n = 10 for T1D women; n = 8 for T1D men.

