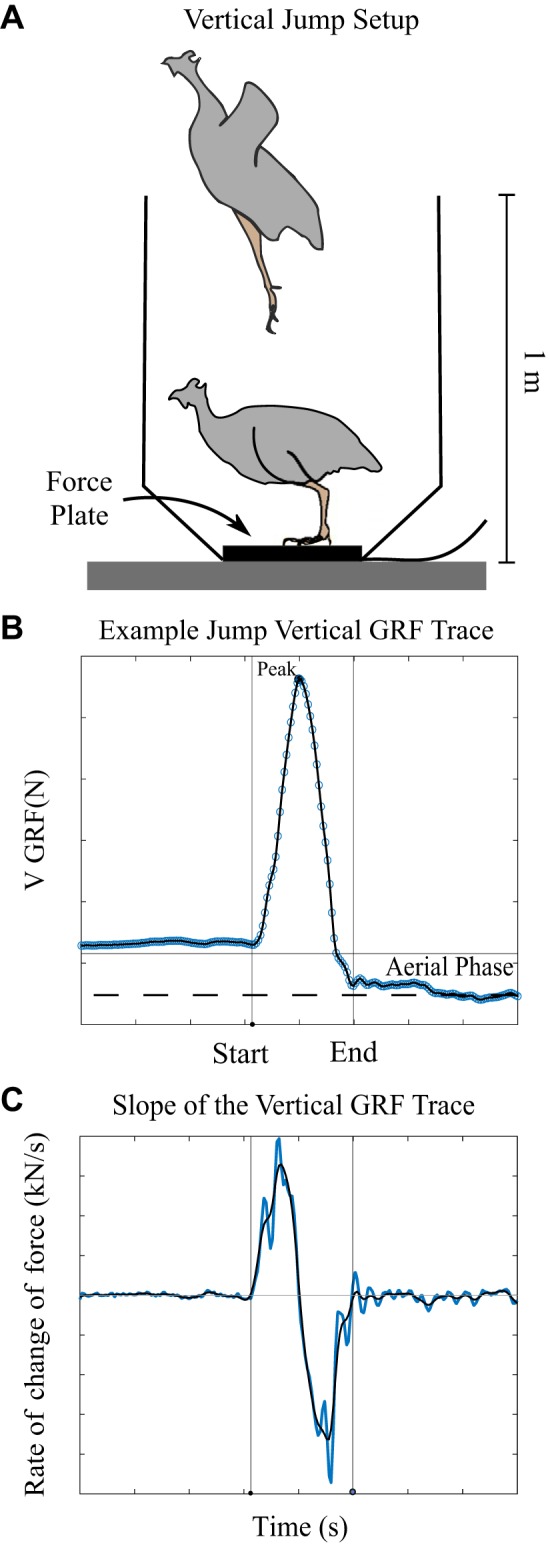
Fig. 2.

A: setup for the jump task at adulthood. B: typical jump trace with jump start and end identified. Blue circles are raw data. The black line is the piecewise polynomial fit. Horizontal gray line shows the weight of the bird. Vertical lines identify the start and end of the jump. C: slope of the force trace (in blue) and the smoothed trace (in black) was used to identify the time of jump initiation and liftoff. Only jumps that included an aerial phase (blue shaded region where the force drops below 0.5 body weights) post peak force production were included in the analysis.
