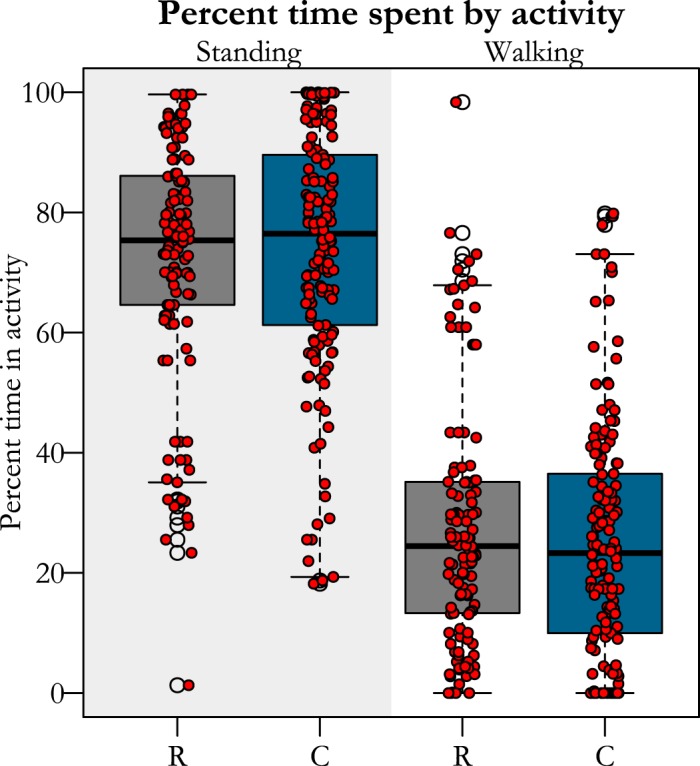
Fig. 3.

Percent of time birds from each treatment (R, restricted; C, controls) group spent either standing or walking. Red dots represent the average time in an activity for one bird during a 5-min window. There were no differences between groups in time spent in either activity.
