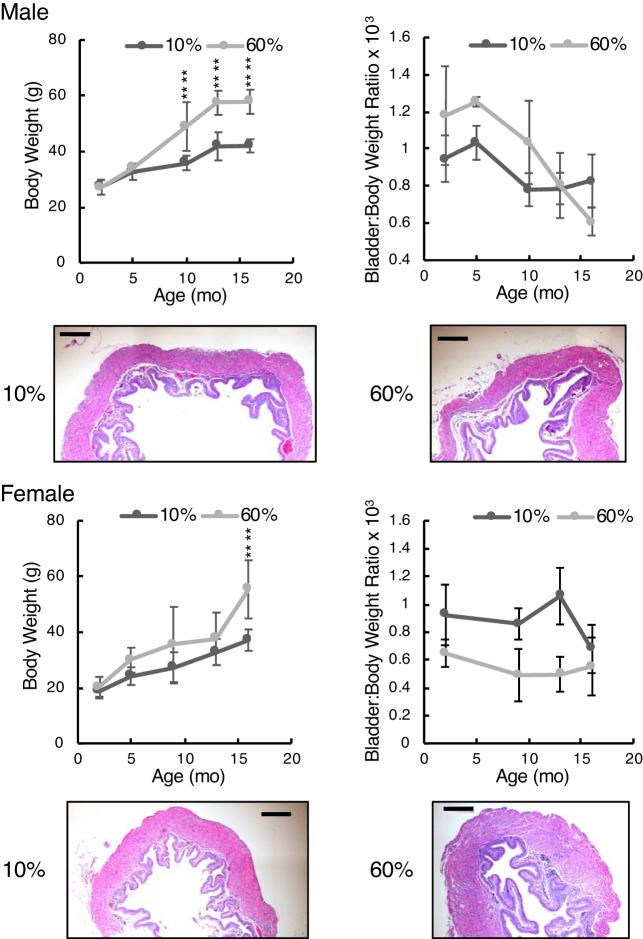
Fig. 5.
Body and bladder-to-body weight ratios shown for diet-induced obese mice. Top: male mice; bottom: female mice. Histology of bladders from low-fat and high-fat diet-fed mice taken at 16 mo of age are shown at identical scales for comparison. Bright-field microscopy was performed using a ×4 objective. Scale bars = 200 μm. Graphic data are shown as means ± SD. Numbers of male mice in the 10% and 60% fat groups for body weights at each age were 9, 9, 14, 21, and 9 and 9, 9, 3, 9, and 9, respectively. For bladder-to-body weight ratio data, n = 3−5 for all. Numbers of female mice in the 10% and 60% groups for body weights at each age were 18, 17, 11, 18, and 14 and 23, 13, 11, 16, and 14, respectively. For bladder-to-body weight ratio data, n = 3−5 for all. Two-way ANOVA with factors “diet” and “age” were both highly significant for male and female body weights ((P < 10−8). Bladder-to-body weight ratios were not significant for diet in male mice but were significant for female mice (P < 10−4). “Strain” differences were determined by post hoc testing (****P < 0.0001).

