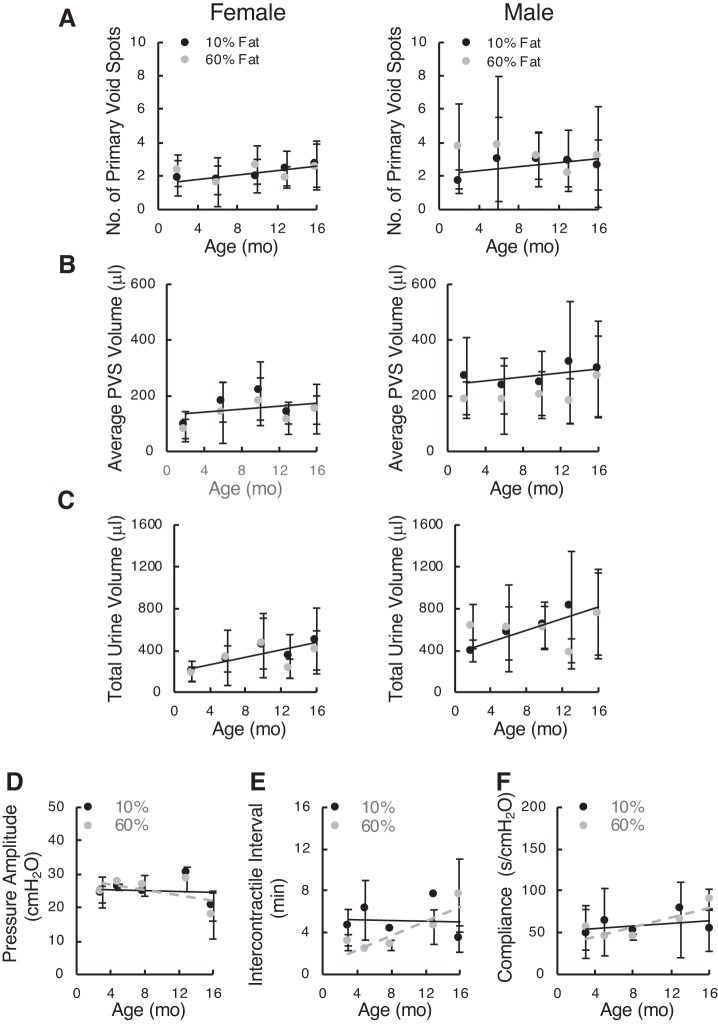
Fig. 7.
Void spot data from diet-induced obese female (left) and male (right) mice and cystometric parameters for female mice tested periodically over 16 mo. A: number of primary void spots (PVSs). B: average PVS volume. C: total urine volume. Data are shown as means ± SD. Since all parameters for both diets essentially overlapped, linear regression was applied to the 10% fat diet data to illustrate any age-related trends. Numbers of female mice on low-fat (10%) and high-fat (60%) diets were 5, 5, 3, 5, and 4 and 10, 15, 14, 9, and 5, respectively. Numbers of male mice on the same diets tested by void spot assay were 3, 9, 4, 5, and 6 and 3, 6, 8, 6, and 6, respectively. D–F: cystometric parameters from diet-induced obese female mice on 10% and 60% fat diets. Mean data and (where n was equal to at least 3) SDs are shown for each age up to 16 mo. Numbers of mice in the 10% and 60% groups at each age were 3, 3, 2, 2, and 3 and 3, 2, 3, 3, and 3, respectively. D: pressure amplitude at voiding (peak − baseline). E: intercontractile interval. F: compliance (calculated from the inverse slope of the filling phase).

