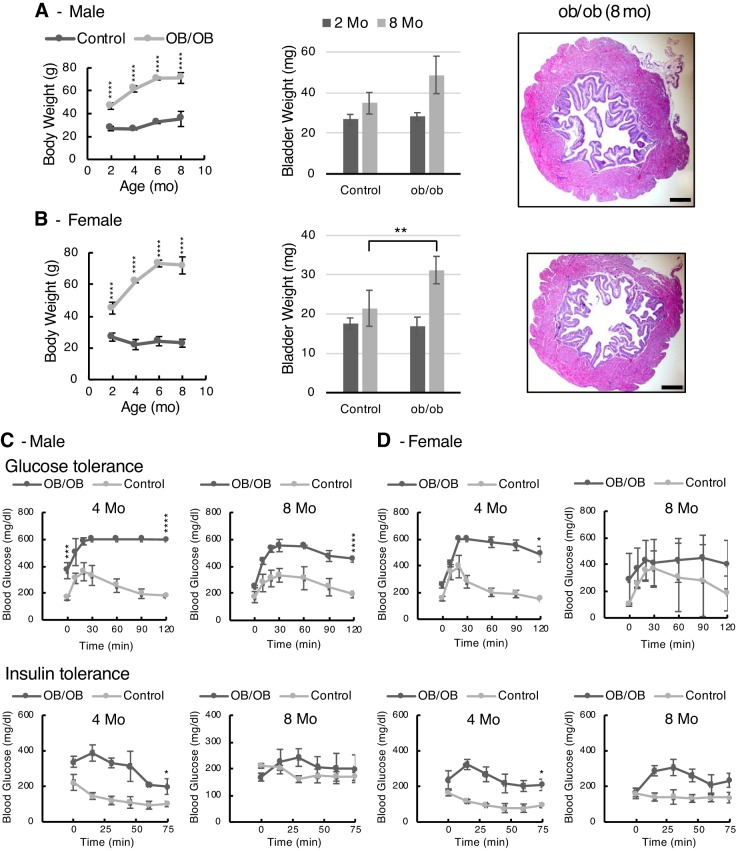
Fig. 8.
Body weights, bladder weights, and metabolic results shown for ob/ob mice. A: male mice; B: female mice. Histology of bladders from low-fat and high-fat diet-fed mice taken at 8 mo of age are shown at identical scales for comparison (scale bars = 200 μm). Bright-field microscopy was performed using a ×4 objective. Graphic data are shown as means ± SD. Numbers of male mice in control and ob/ob groups for body weights at each age were 3, 7, 6, and 6 and 3, 3, 3, and 6, respectively. For bladder weights, n = 3 for control mice and 3 and 6 for ob/ob mice. Numbers of female mice in control and ob/ob groups for body weights at each age were 3, 4, 6, and 7 and 5, 3, 3, and 3, respectively. For bladder weights, n = 3 for control mice and 5 for ob/ob mice. C and D: glucose and insulin tolerance tests of ob/ob male (C) and female (D) mice at 4 and 8 mo of age. For the glucose tolerance test, after an overnight fast and baseline blood glucose measurement, mice were given an injection of glucose solution (2 g/kg ip) and then had blood glucose measured over time. Significance testing was performed for baseline glucose (time 0) and glucose concentration at 120 min. For the insulin tolerance test, after a fast and baseline blood glucose measurement, insulin was injected (0.75 IU/g ip), and glucose was then measured for 75 min. Significance testing was performed for equilibrium glucose concentration (lowest value). Data are means ± SD; n = 3 mice/group. “Strain” differences were determined by post hoc testing (*P < 0.05, **P < 0.01, ***P < 0.001, and ****P < 0.0001).

