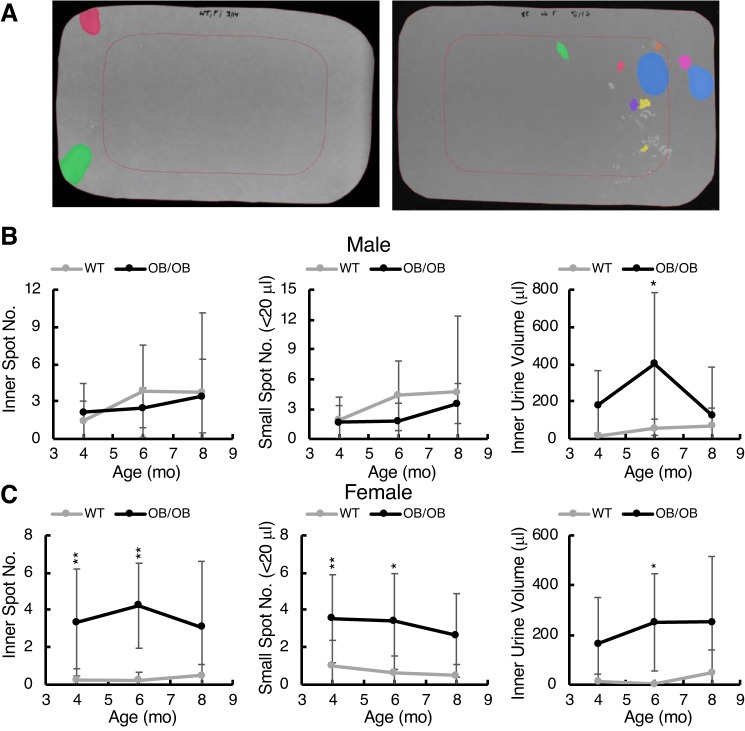
Fig. 11.
Urine localization analysis and small spot volume analysis from void spot assays. A: examples of filter papers with pseudocolored urine spots and the “inner” region representing 50% of the filter area, defined by the red rectangle. Left: a control female mouse; right: a female ob/ob mouse at 6 mo. Female ob/ob mice showed micturition within the inner region, which was rare for control mice. Quantitation of this phenomenon is shown for male (B) and female (C) mice with graphs from left to right showing inner spot number, total small spot number (defined as 5- to 20-μL spots), and inner spot area total volume. Data are shown as means ± SD. Two-way ANOVA with Tukey’s post hoc testing for differences between strains was used to determine significance (*P < 0.05; **P < 0.01). Age was not a significant contributor.

