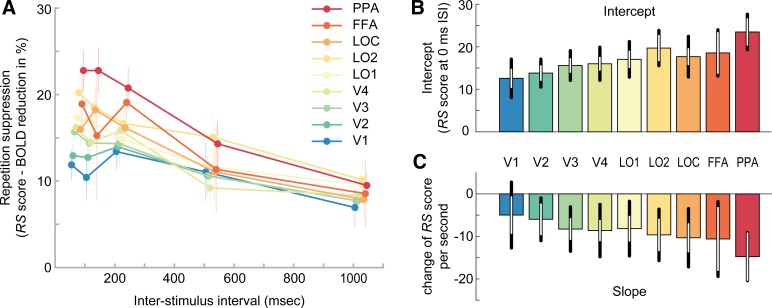
Fig. 3.
Relative repetition suppression across visual areas and interstimulus intervals. A: repetition suppression (RS) score of each region of interest (ROI; color coded) as a function of interstimulus interval (ISI). The RS score indicates the percentage reduction of blood oxygen level-dependent (BOLD) amplitude for repeat relative to nonrepeat trials. Positive RS scores mark RS. While all ROIs show RS, the strength of RS increases from posterior to anterior regions. Furthermore, RS decreases for increasing temporal lags between image presentations. Error bars denote SEs. B: mean intercept estimates of linear models fitted to single subject data in A. Intercept estimates increase from posterior to anterior regions. Black error bars denote 95% confidence intervals. White error bars denote 95% within-subject confidence intervals. C: mean slope estimates of linear models, indicating the decay of RS scores over time. FFA, fusiform face area; PPA, parahippocampal place area; V1–V4, visual areas 1–4; LOC, lateral occipital complex; LO1 and LO2, lateral occipital areas 1 and 2. See Supplemental Fig. S3 (https://figshare.com/articles/Supplemental_Figure_S3/10043183) for single subject estimates of intercepts and slopes, Supplemental Fig. S4 (https://figshare.com/articles/Supplemental_Figure_S4/10043192) for model fits, and Supplemental Fig. S5 (https://figshare.com/articles/Supplemental_Figure_S5/10043198) for residual plots.

