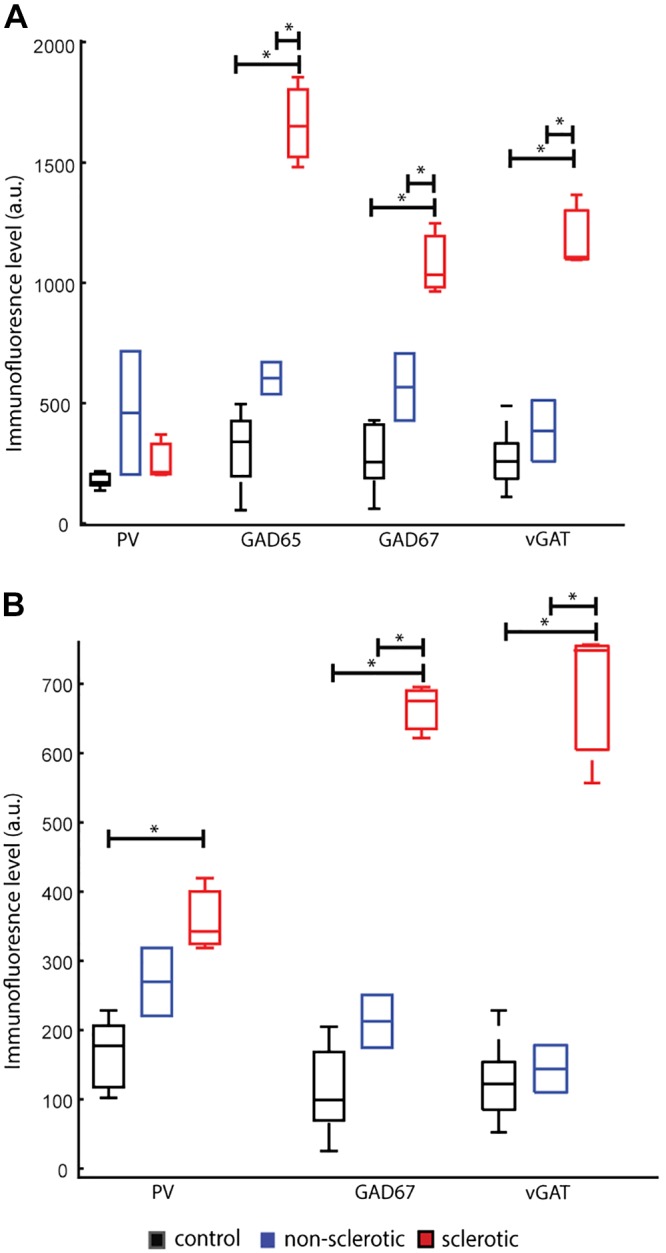
Fig. 9.

Epilepsy-related increase in parvalbumin (PV)-immunoreactive bouton immunofluorescence levels. A and B: boxplots representing PV basket cell bouton protein level profile across the diagnostic groups (A) as measured by the immunofluorescence of PV, glutamic decarboxylase (GAD) 65, GAD67, and vesicular GABA transporter (vGAT) and PV chandelier cell bouton protein level profile across the diagnostic groups (B) as measured by the immunofluorescence of PV, GAD67, and vGAT. Boxplots are based on the average of all imaging sites per subject with the central mark representing the median in each group, tails represent the 99th confidence interval; a.u. = arbitrary unit. Each diagnosis group was assigned a color: red: sclerosis; blue: nonsclerosis; black: control. *P < 0.05, significant interactions in post hoc analysis.
