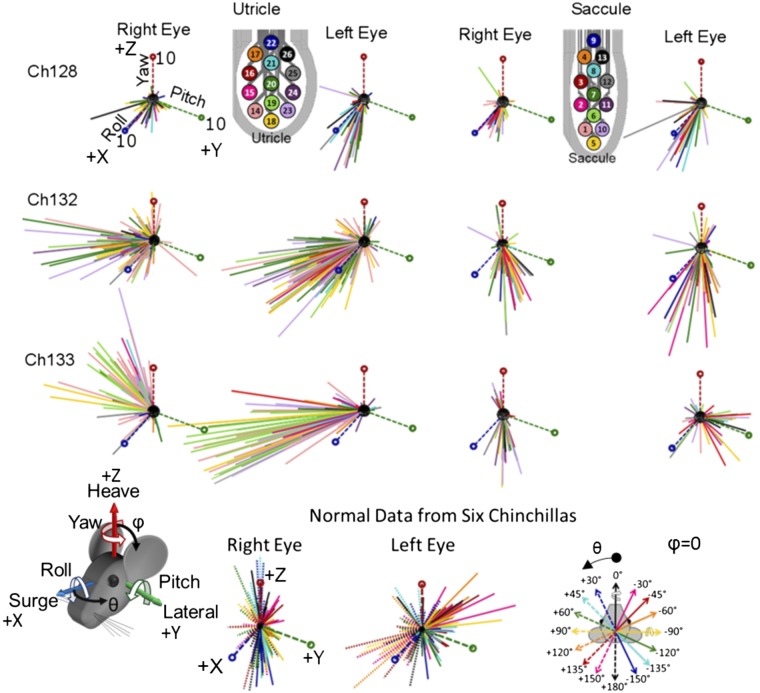
Fig. 11.
All results from utricle and saccule pulse train stimulation for the 3 chinchillas. Each line represents the axis of the final angular eye position in degrees and is colored based on the stimulating electrode used, as indicated in the color-coded utricle and saccule electrodes in the bottom right. Each plot contains the primary axes, Roll (+X), Pitch (+Y), and Yaw (+Z), which are all magnitude of 10°, as shown in the top left image. Bottom row: final ocular countertilt position recorded from six normal chinchillas during 20° from horizontal whole body tilts about each of the axes in the legend, which follows the right-hand rule to indicate direction of tilt. By looking at all the nonnormalized responses, certain patterns of encoded head tilts with the stimulation data begin to emerge. With the use of the utricular array, the responses trend toward the (+X,−Y) quadrant with a larger left eye magnitude compared to the right. When comparing to the normal data (collected from the Earth-horizontal axes shown in the bottom right), the utricular responses primarily follow the +120, +135, and +150° axes. Shifting to the saccular data, for Ch128, responses due to saccular stimulation follow similar direction as the utricle. However, for Ch132 and Ch133, a difference is seen between utricle and saccule responses. The left and right magnitudes are more symmetric and match the −120, −135, −150, and +180° normal tilt axes (solid green, light blue, dark blue, and dashed black).

