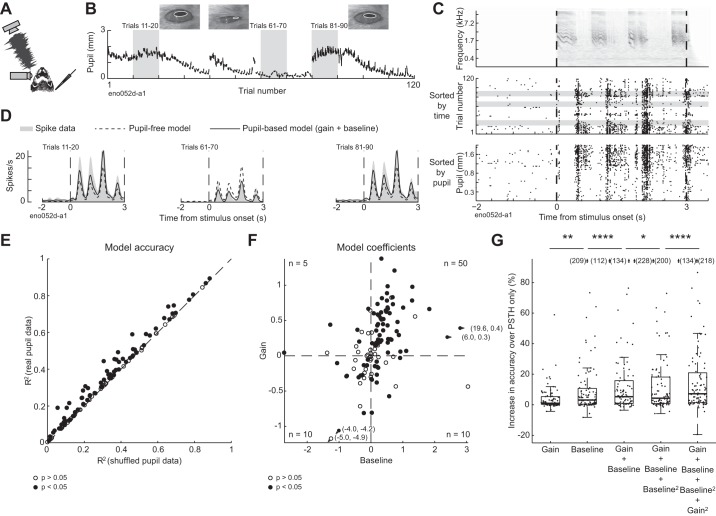
Fig. 1.
Trial-to-trial variability in neural responses to sound tracks changes in pupil size. A: schematic of experiment, illustrating ferret, free-field speaker, camera recording video of eye, and contralateral extracellular electrode. B: pupil trace recorded across 120 repetitions of 1 ferret vocalization, with example video frames. C: spectrogram of 1 ferret vocalization (top) and spike raster of 1 neuron’s response to the vocalization, sorted by time (middle) and prestimulus pupil size (bottom). D: predicted and actual pupil-dependent changes in spiking activity for the neuron represented in B and C. Graphs show peristimulus time histogram (PSTH) responses averaged across blocks of 10 stimulus presentations selected from epochs with different pupil size [see B; PSTHs predicted by the null model (dashed lines) and baseline + gain model (solid lines) are overlaid on the actual PSTH (shading)]. E: accuracy of pupil-based baseline-gain regression model for neural responses to ferret vocalizations (n = 114 neurons), plotted against accuracy of a control, PSTH-only model, fit to temporally shuffled pupil data from each cell. Closed circles indicate neurons with a significant improvement over the control model (n = 75/114; P < 0.05, permutation test). F: coefficients of baseline-gain model for all data from vocalization recordings (n = 114 neurons). Positive values indicate an increase in baseline spike rate (horizontal axis) or response gain (vertical axis) with larger pupil. Numbers in corners of each quadrant indicate the count of neurons with parameters with a significant improvement in prediction accuracy over the control, pupil-independent model in that quadrant. G: improvement in accuracy over PSTH-only model for various models for population of neurons with a significant fit for any model (n = 92/114). *P < 0.05; **P < 0.01; ****P < 0.0001, sign test. Boxplot indicates median, interquartile range, and 1.5 times the interquartile range.

