Fig. 8.
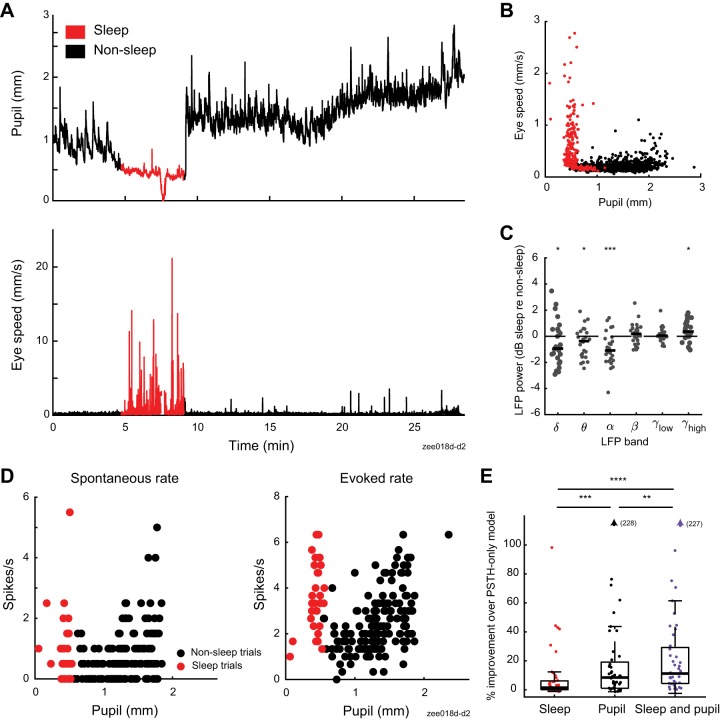
Sleep states account for additional variability in neural responses. A: pupil size and eye speed traces from 1 recording. B: pupil size and eye speed data from 1 ferret (13 recordings). Each point illustrates average pupil size and eye speed during 1 trial (5.5 s). Color indicates whether a trial was classified as sleep (red) or nonsleep (black), using criteria based on eye movement and pupil size data (see methods). C: relative change in local field potential (LFP) power between recording segments with and without sleep, matched for pupil size (n = 26 recordings). Thick horizontal bar indicates population median. *P < 0.05; ***P < 0.001, rank-sum test on hypothesis that median is equal to 0. D: spontaneous (left) and sound-evoked neural data (right) from recording shown in A. Each circle indicates spike rate before or during 1 vocalization (prestimulus period = 2 s, stimulus period = 3 s). E: stepwise regression results for models including sleep state, pupil size, or both sleep state and pupil size as predictors of spike rate (n = 44 neurons with significant fit for any model and recorded during experiments that include sleep episodes). **P < 0.01; ***P < 0.001; ****P < 0.0001, sign test. Boxplot indicates median, interquartile range, and 1.5 times the interquartile range.

