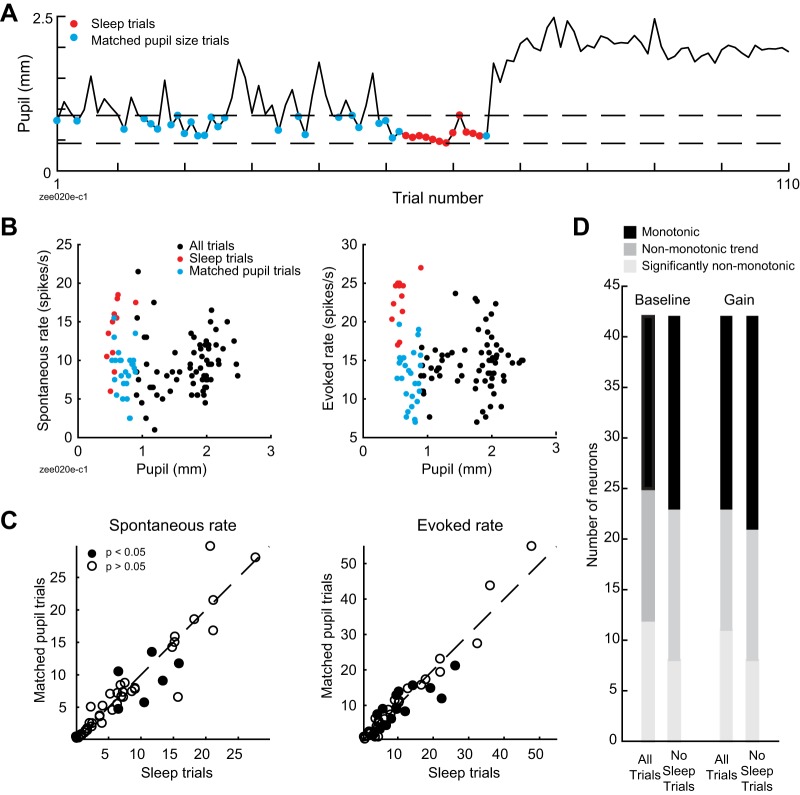
Fig. 9.
Sleep state accounts for nonmonotonicity in some neurons. A: mean prestimulus pupil size for responses to 1 ferret vocalization, highlighting sleep trials (red) and trials with matched prestimulus pupil size (blue). B: spontaneous (i.e., prestimulus; left) and stimulus-evoked neural activity (right) from recording in A, illustrating greater spike rate in sleep trials compared with trials with matched pupil size. C: average spontaneous (left) and sound-evoked spike rate (right) during sleep trials vs. trials with matching pupil size (n = 47 neurons recorded in experiments including sleep episodes). Closed circles indicate neurons with a significant difference in spontaneous or sound-evoked rates (P < 0.05, unpaired t test). D: results of test for nonmonotonicity using segmented regression model fit to all data or to data with sleep trials removed (n = 42 neurons recorded in experiments including sleep episodes and showing significant fit to second-order baseline-gain regression model).

