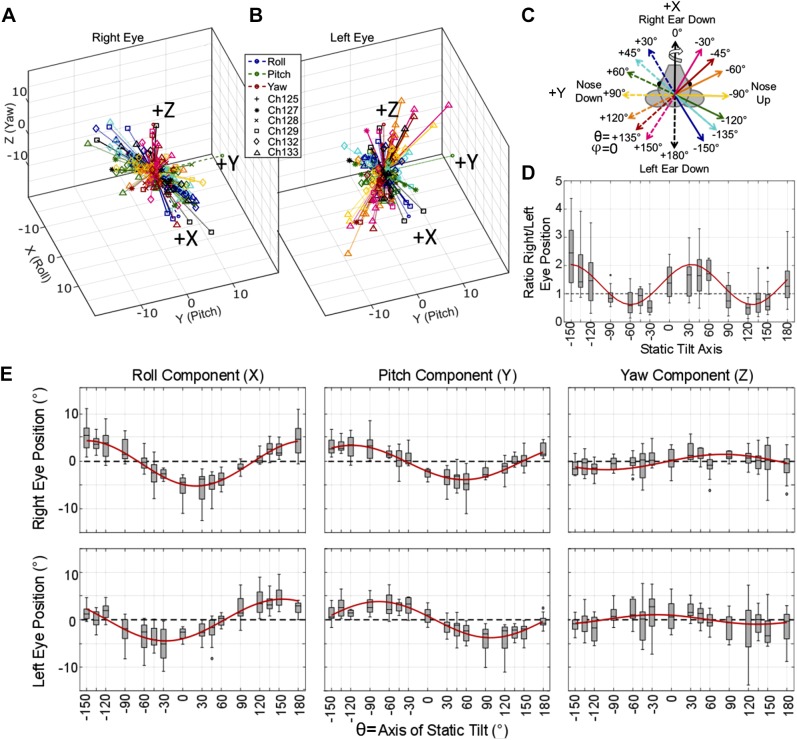
Fig. 4.
Ocular countertilt responses recorded from 6 chinchillas during static tilts. A–C: summary (A and B) of all ocular countertilt responses during the last 5 s of a 40-s whole body tilt, measured for all 6 chinchillas during 20° static whole body tilts about the 16 axes indicated in C. A and B: right eye and left eye responses, respectively, for all 6 animals, with vector direction describing the axis of eye tilt response rotation and vector length describing the angle, in degrees, of that tilt rotation response. Each animal is denoted uniquely by a marker defined in B. Each response vector is color coded to represent the stimulus tilt axis as shown in the legend in B. The direction of eye movement response is described using the right-hand rule, as shown by the curved arrow around the solid black “Right Ear Down 0°” vector in C. The data summarized across all 6 animals in A and B are shown individually for each animal in Supplemental Fig. S1 (https://doi.org/10.6084/m9.figshare.10275386). An asymmetry is seen between the magnitude of the change in angular eye position of the right and left eye during tilts with a larger change in angular eye position during tilts about axes aligned with the contralateral eye. Tilts about the naso-occipital and interaural axes elicit ocular countertilts in the left and right eye of similar magnitude. D: to further illustrate this asymmetry, a boxplot of the ratio of right/left eye ocular countertilt position is shown. E: component-wise results from all static tilts in the 6 animals is shown. Outliers larger than 3 times the interquartile range were removed for both D and E (<11 of 184 samples were removed for each plot). Nonlinear mixed-effect models were created to predict each component of eye movement and the ratio of right eye/left eye magnitude based on the tilt axis, with a fixed effect of tilt axis and a random effect of chinchilla ID number, meaning that the fit is conditional on individual animals, (Bolker et al. 2009). The fits are shown in red, with root mean square error ≤2.53 for all fits. All fit parameters are detailed in Table 2. Each axis of static tilt has sample number n ≥ 11.

