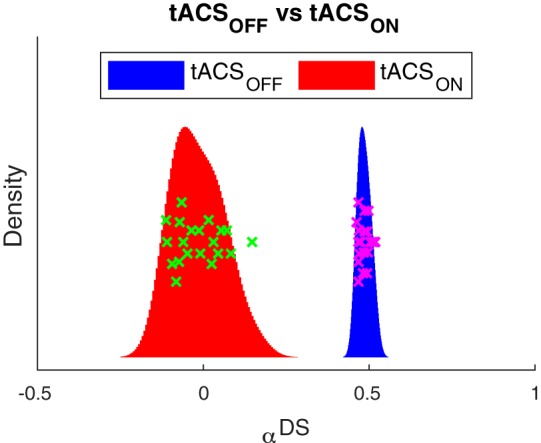
Fig. 3.

Transcranial alternating current stimulation (tACS) reduces blood oxygen level-dependent adaptation in human motion area (hMT+). Histograms show the distribution of the strength of adaptation (αDS) in left and right hMT+ separately for the blocks without (tACSOFF; blue) and with (tACSON; red) stimulation. Data points (one cross for each left and right hMT+ in each subject) illustrate the variability separately for tACSOFF (magenta) and tACSON (green). The vertical position of these points carries no meaning; it serves only to separate the points. The histograms were estimated using a normal kernel density estimator; hence, the y-position represents the relative density/probability of the corresponding adaptation value on the x-axis. Adaptation was much reduced in the tACSON blocks compared with the tACSOFF blocks.
