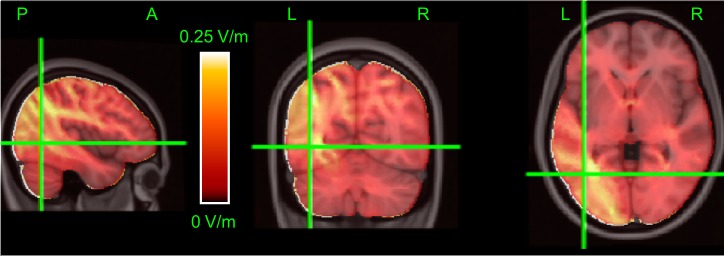
Fig. 8.
Intracranial fields. Color represents the magnitude of the estimated fields based on a finite-element current-flow model of the MNI 152 template T1-weighted MRI (see materials and methods). Color bar shows the mapping between color and field magnitude; the range was clipped at 0.25 V/m to improve visual clarity. Crosshairs identify the nominal center of left human motion area (hMT+), the area of a priori interest. Predominantly hot (yellow) colors near the crosshairs show that field magnitudes in left hMT+ were among the largest, providing post hoc reassurance that our montage did stimulate this area. However, several other regions in parietal and visual cortex received similarly strong stimulation. Labels indicate left (L), right (R), anterior (A), and posterior (P) parts of the brain.

