Fig. 9.

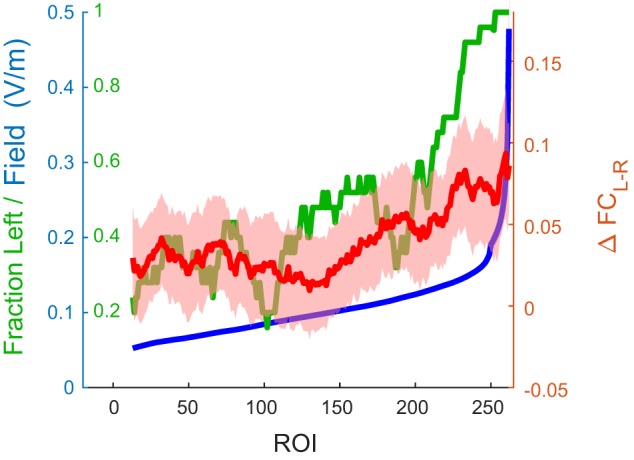
Transcranial alternating current stimulation (tACS) increases functional connectivity (FC) with human motion area (hMT+) in a dose (field magnitude)-dependent manner. Horizontal axis represents the rank order of the field strength in each region of interest (ROI) of the Power atlas. Blue curve (associated with blue labels on left axis) shows the estimated field strength in each of the ROIs. Red curve (associated with right axis) shows the excess change in FC for left hMT+ (ΔFCL-R) for each ROI. Green curve (associated with green labels on left axis) shows the fraction of ROIs in the left hemisphere. For visualization purposes only, all curves were smoothed (25 nearest neighbors); line shading spans 1 SE of the mean across subjects. Graph shows that ΔFCL-R was larger in ROIs with larger field strengths. See main text for the supporting statistical analysis.
