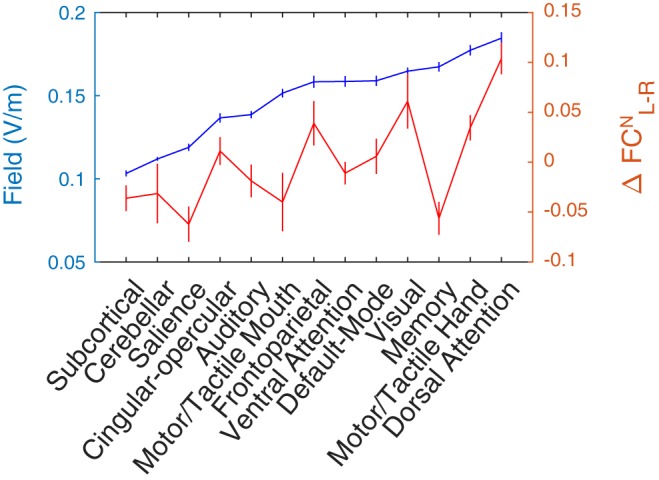
Fig. 10.

Transcranial alternating current stimulation (tACS) increases network-level functional connectivity (FCN) with human motion area (hMT+) in a dose (field magnitude)-dependent manner. Horizontal axis represents the 12 networks of the Power atlas. Blue curve (associated with left axis) shows the 90th percentile of the field strength across the regions of interest of the corresponding network. Networks were rank ordered with respect to this measure. Red curve (associated with right axis) represents the excess change in FC of the left hMT+ compared with the right hMT+ (). Error bars span 1 SE of the mean across subjects. With a notable exception of the memory retrieval network, networks with large field magnitudes had the largest FC changes. See main text for the supporting statistical analysis.
