Fig. 1.
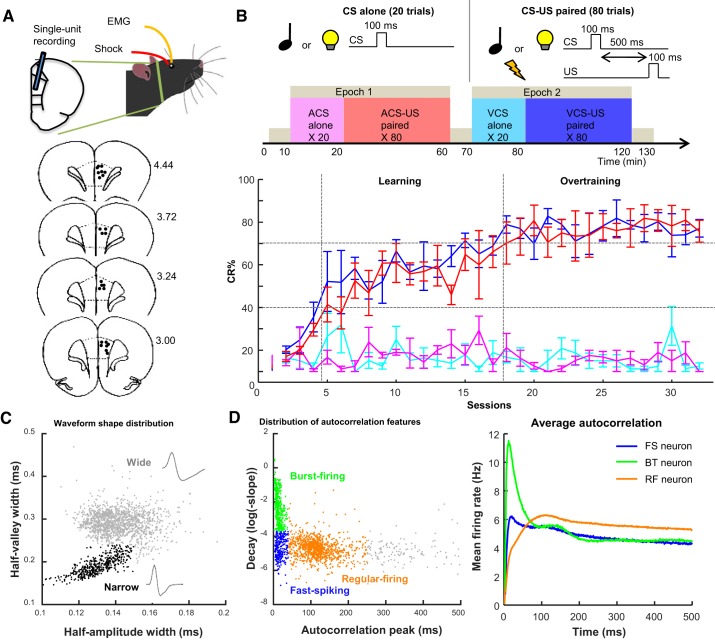
Behavior and neuron classification. A: rats were implanted with 4 wires into the eyelid and an array of 14 tetrodes in the prelimbic region of the medial prefrontal cortex (mPFC). In schematic diagrams of coronal sections (bottom), black dots indicate the final location of tetrode tips; numbers at right show the anterior-posterior coordinates from bregma. B: rats received 2 epochs of trace eyeblink conditioning, during which either a tone (auditory conditioned stimulus, ACS) or light (visual conditioned stimulus, VCS) was presented alone (CS alone; 20 trials) or preceding mild eyelid shock (US) by 500 ms (CS-US; 80 trials). The rate of expression of the conditioned response (CR%; n = 4 rats; means ± SE) was increased over days for both ACS-US (red) and VCS-US (blue) trials, but not during the respective CS-alone trials (magenta, turquoise). Based on CR% in CS-US trials, sessions were divided into learning and overtraining phases. C: distribution of half-amplitude (depolarization) width and half-valley (afterhyperpolarization) width of spike waveforms of all neurons. Neurons with shorter half-valley width (narrow waveform; black) were classified as putative inhibitory neurons. The remaining neurons with wide waveforms (gray) were classified as putative excitatory projection neurons. D: peak latency and downward slope of autocorrelograms were calculated in each neuron. The distribution of these features (left) allowed for dividing neurons into 3 groups: fast-spiking (FS; early peaks and slow decay; blue), burst-firing (BT; early peaks and rapid decay; green) and regular-firing (RF; later peaks and slower decay; orange) types. The averaged autocorrelograms of all neurons in each type (right) confirmed their difference in firing characteristics.

