Figure 7.
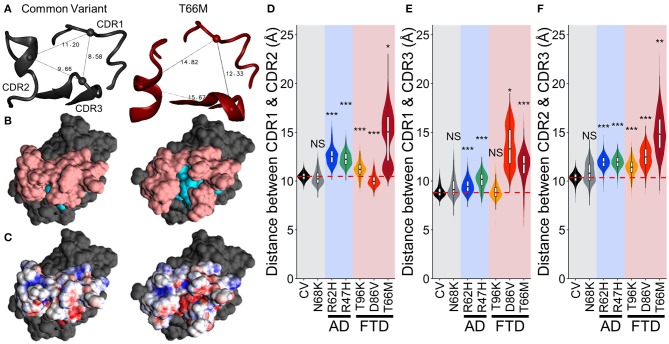
Increased fluctuations from FTD- and AD-associated variants of TREM2 separate the CDRs without altering TREM2 structure. (A) Representative structures showing distance measurements between alpha carbons of residues 45, 72, and 90—representing CDR1, CDR2, and CDR3 respectively—for examined isoforms of TREM2. (B) Representative surface structures from an apical view in the same orientation as (A), indicating the CDR (pink) and novel binding site (cyan). (C) Electrostatic potential maps indicating regions of positive (blue) and negative (red) charge. (D–F) Orchestra plots showing distributions of distances between all three pairs of CDRs for each isoform of TREM2 over the equilibrated trajectory, using violins to show both normality and probability density and superimposed box/whiskers to show quartiles. The median of the CV protein is shown as the dotted red line in each for comparison. P-values are shown based on comparison to CV (NS, not significant, *P < 0.05, **P < 0.01, ***P < 0.001, Welch's ANOVA, Games-Howell post-hoc).

