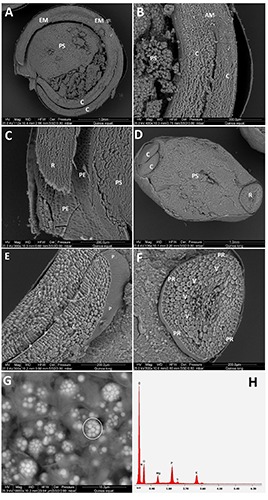
Figure 4.

ESEM analysis of sections of quinoa seed. A) Transverse section; D) longitudinal section; B,C,E,F) cotyledon and root details; G) high magnification of globoids inside cells of the root typ’s cortical layer; the surrounded area represents the field for the analysis showed in H. H) Elemental composition of the cell globoids. AM, apical meristem; C, cotyledons; EM, embryo axis; P, protective sheath; PE, pericarp; PR, protoderm; PS, perisperm; R, radicle; V, vascular bundles.
