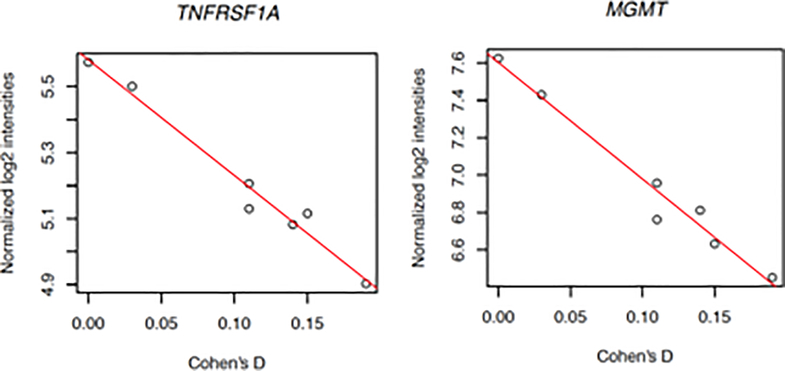
Figure 2:
A strongly negative correlation of TNFRSF1A expression and Cohen’s d was identified in adult brain samples (Pearson’s r = −0.986, p-value < 3.84e-05, Bonferroni p-value < 0.027). A similar correlation was found for MGMT with the same samples (Pearson’s r = −0.983, p-value = 6.67e-05, Bonferroni p-value = 0.046). A total of 704 genes were examined across pathways for apoptosis, autophagy, and oxidative stress.

