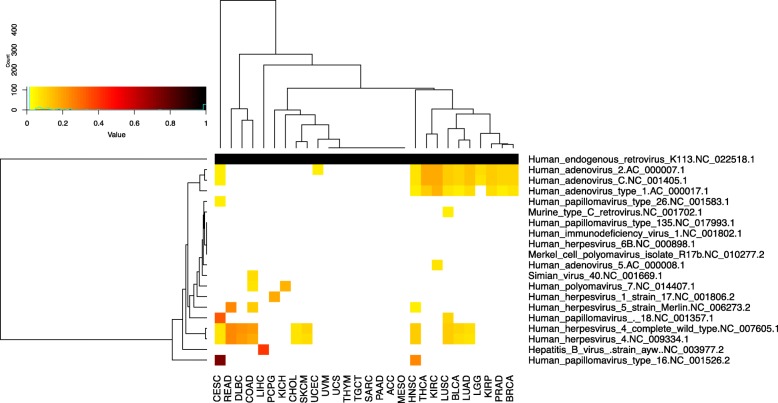
Fig. 2.
Prevalence of viral expression in TCGA. Viruses with > 5% prevalence in any TCGA cohort sequenced at UNC are shown on the y-axis and cancer types are on the x-axis. The color of each cell represents the proportion of samples with expression (> 2 reads) of each virus, if the prevalence is > 5%. Human endogenous retrovirus K113 was displayed as a positive control, since all samples have should express it

