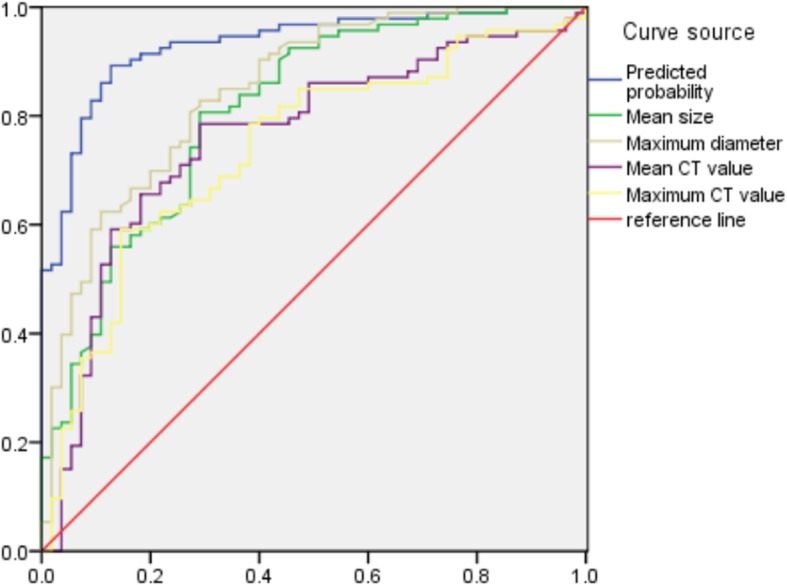
Fig. 6.

Graph shows ROC curves predicted MIA and IAC value, Predicted probability, mean size, maximum diameter, mean CT value and maximum CT value, and the areas under the curve for the identification of MIA were were 0.931, 0.809, 0.874, 0.760, and 0.739, respectively The area under the curve, sensitivity and specificity were higher than for the single factor analysis indicators of various quantitative parameters
