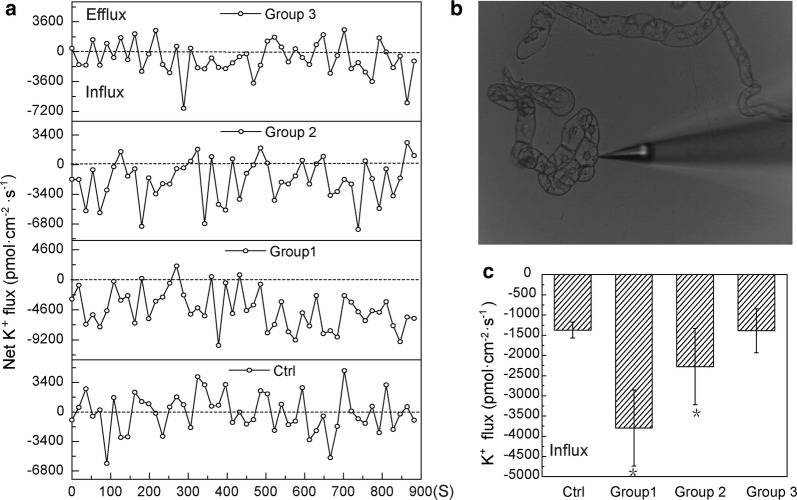
Fig. 6.
Effects of CNPs and inhibitor treatments on net K+ fluxes in BY-2 cells. a K+ fluxes were determined with after different CNPs treatments lasting for 900 s measurements. b Schematic diagram of test sample. c Mean value of K+ fluxes at different concentration of CNPs in cells. Group 1: 62.50 μg/mL CNPs, Group 2: 125.00 μg/mL CNPs, Group 3: 125.00 μg/mL CNPs + 10 mM TEA+. The mean value of each group contains six individual cell, and error bars represent SE, n = 6. Asterisk (*) indicates significant difference compared with control group (p < 0.05)

