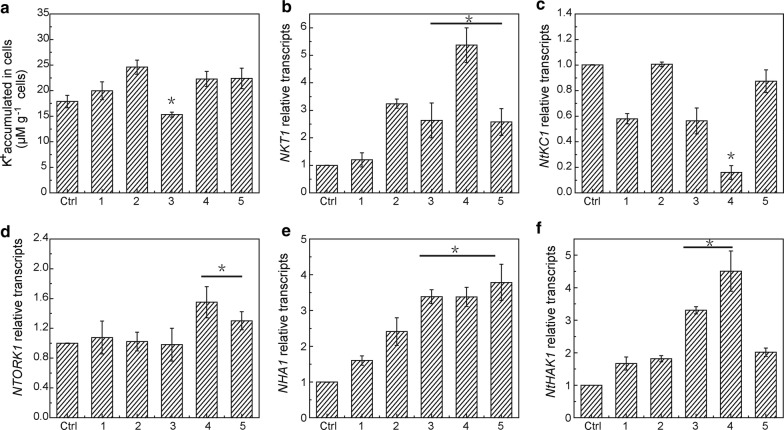
Fig. 7.
K+ accumulation (a) and gene expression (b–f) in BY-2 cells treated with CNPs and inhibitors. Cells were treated with CNPs for 12 h and gene expression was measured by quantitative RT-PCR. Data represent the mean and SE (n = 3). Values of actin relative transcripts were normalized to 1. Asterisk (*) indicates significant difference compared with control group and group containing 46.88 mM K+ without CNPs (p < 0.05). 1: 46.88 mM K+, 2: 46.88 mM K+ + 62.50 μg/mL CNPs, 3: 46.88 mM K+ + 62.50 μg/mL CNPs + 10.00 mM TEA+, 4: 46.88 mM K+ + 62.50 μg/mL CNPs + 0.16 mM genistein, 5: 46.88 mM K+ + 62.50 μg/mL CNPs + 0.30 mM methyl-β-cyclodextrin

