Fig. 1.

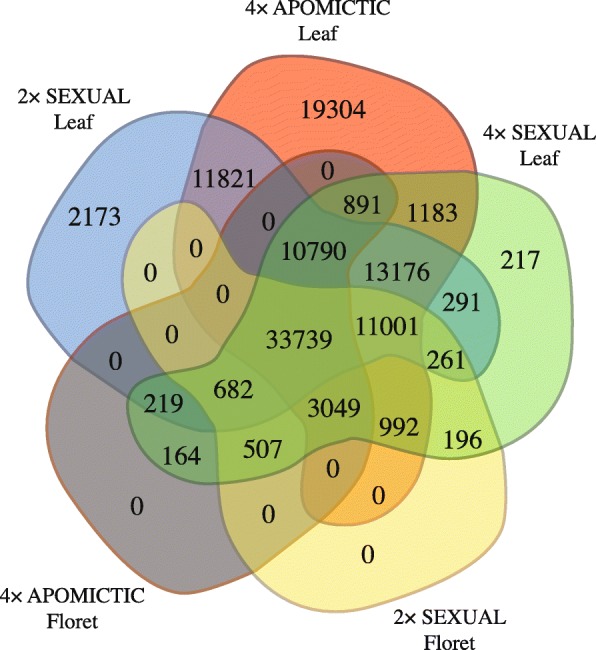
Venn diagram showing the distribution of the P. notatum transcripts. Expression level of transcripts from two tissues (floret and leaf) from each phenotypic class (sexual diploid, sexual tetraploid, and apomictic tetraploid)

Venn diagram showing the distribution of the P. notatum transcripts. Expression level of transcripts from two tissues (floret and leaf) from each phenotypic class (sexual diploid, sexual tetraploid, and apomictic tetraploid)