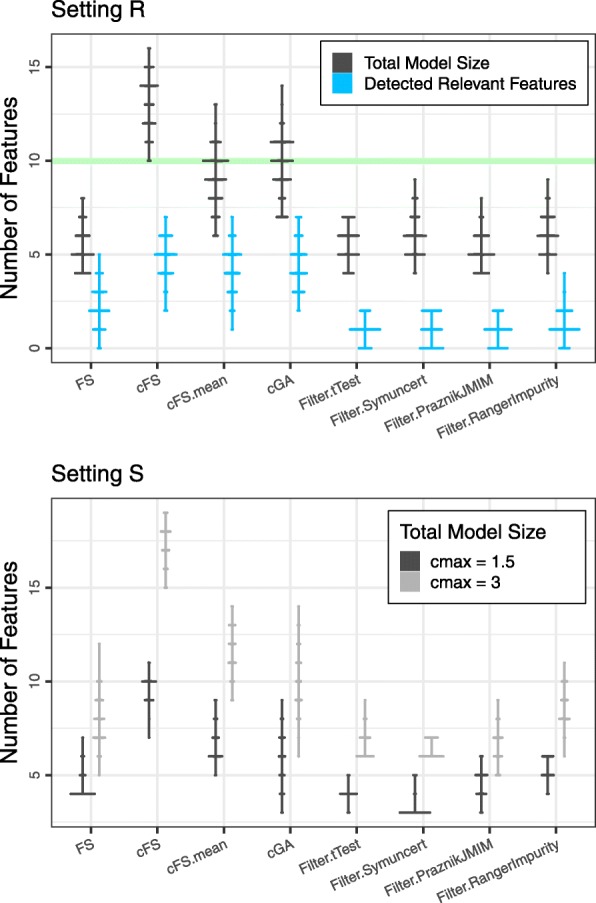
Fig. 7.

Discretized violin plots of the relevant feature count distribution (blue) and the total model size distribution (black) for the 100 analyzed training-test splits of the plasmode simulation. The green bar indicates the maximum number of relevant features that can be added within the budget of this setting. Bottom: Setting S. Discretized violin plots of the distribution of total model size for the analyzed budget limits cmax=1.5 (black) and cmax=3 (gray)
