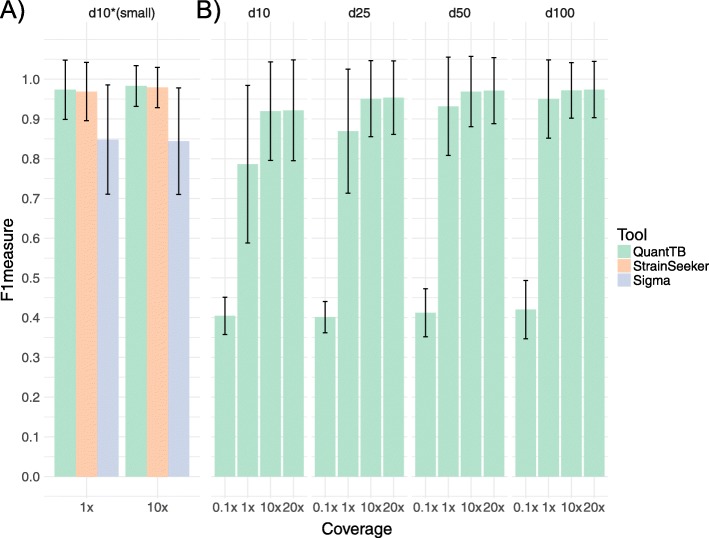
Fig. 3.
Benchmarking results of synthetically mixed read sets of three different strain identification tools, QuantTB, StrainSeeker and Sigma. A) Results from a smaller database (d10small, n = 200) are shown for all tools for coverage levels of 1× and 10×, B) results from four larger databases (see Table 1) are shown only for QuantTB, for coverages ranging from 0.1× − 20x

