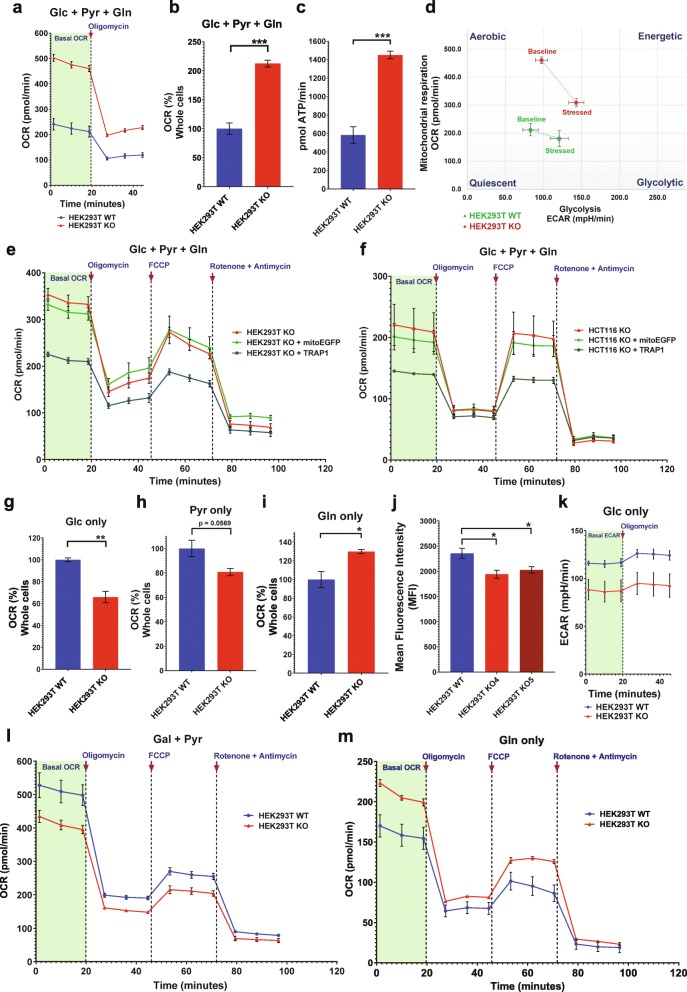
Fig. 1.
Real-time metabolic profiling of human TRAP1 KO cells. a Representative real-time traces of basal OCR of WT and TRAP1 KO HEK293T cells with Glc + Pyr + Gln as carbon sources followed by injection of the ATP synthase inhibitor (oligomycin at 5 μM) to block mitochondrial respiration. b, c Quantitation of basal respiration rates (b) and ATP production (c). ATP production is calculated as (last measurement before oligomycin injection) − (minimum rate measured after oligomycin injection). d Comparative energy profiles. The baseline phenotype indicates OCR and ECAR of cells with starting non-limiting assay conditions; the stressed phenotype indicates OCR and ECAR upon exposure to metabolic inhibitors. e, f OCR traces with and without the overexpression of TRAP1 or mitoEGFP in HEK293T KO (e) and HCT116 TRAP1 KO (f) cells. The mitochondrial stress test profile is obtained by sequential injection of oligomycin (5 μM), the uncoupler FCCP (2 μM), and the complex I and III inhibitors rotenone (1 μM) and antimycin A (1 μM), respectively. g–i Comparison of basal OCR of WT and KO HEK293T cells with Glc (g), Pyr (h), and Gln (i) as the only carbon sources. j Flow cytometric quantitation of glucose uptake using 2-NBDG (150 μg/ml) with WT and two independent TRAP1 KO HEK293T clones. k ECAR traces showing basal glycolytic rates of WT and KO HEK293T cells with Glc as the only carbon source before and after the addition of oligomycin. l, m OCR traces of WT and KO HEK293T cells grown in media with Gal + Pyr (l) and Gln (m) as the only carbon sources. All data are reported as means ± SEM (n = 3) with asterisks in the bar graphs indicating statistically significant differences (*p < 0.05, **p < 0.01, and ***p < 0.001)

