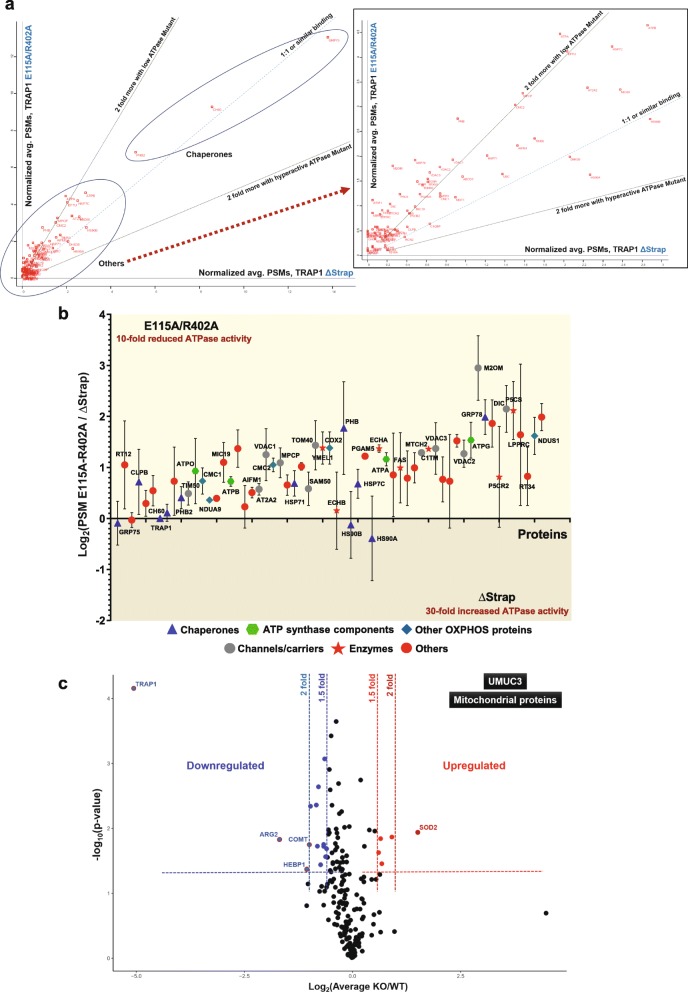
Fig. 4.
TRAP1 proteomics. a Comparative relative abundance of proteins immunoprecipitated with the indicated TRAP1 ATPase mutants. The scatter plot shows the 81 proteins common to WT TRAP1 and the 2 ATPase mutants; it was constructed with an average of normalized PSM values (TRAP1 itself was set to 100) to compare the interactomes of TRAP1 mutants E115A/R402A with low ATPase activity (Y-axis) and the hyperactive ATPase mutant ΔStrap (X-axis); the bigger the distance from the origin on either axis, the more binding there is. Proteins with low PSM values were not necessarily identified in all 3 replicates for a given TRAP1 mutant. The dashed red arrow connects the area near the origin of the plot to the zoomed out inset. b Relative quantitation of protein binding to the TRAP1 mutants E115A/R402A and ΔStrap based on log2 ratios of normalized PSM values. Proteins above the X-axis interact more with the mutant E115A/R402A than the mutant ΔStrap. The list of 81 common proteins is reduced to 61 for this analysis since only proteins identified in at least 2 replicates for each TRAP1 mutant were included. c Volcano plot showing up- or downregulated mitochondrial proteins in a comparison of WT and TRAP1 KO UMUC3 cells. These data are based on the SILAC analysis of the whole cell proteome filtered for mitochondrial proteins (200 proteins found in all three replicates in both WT and KO cells)

