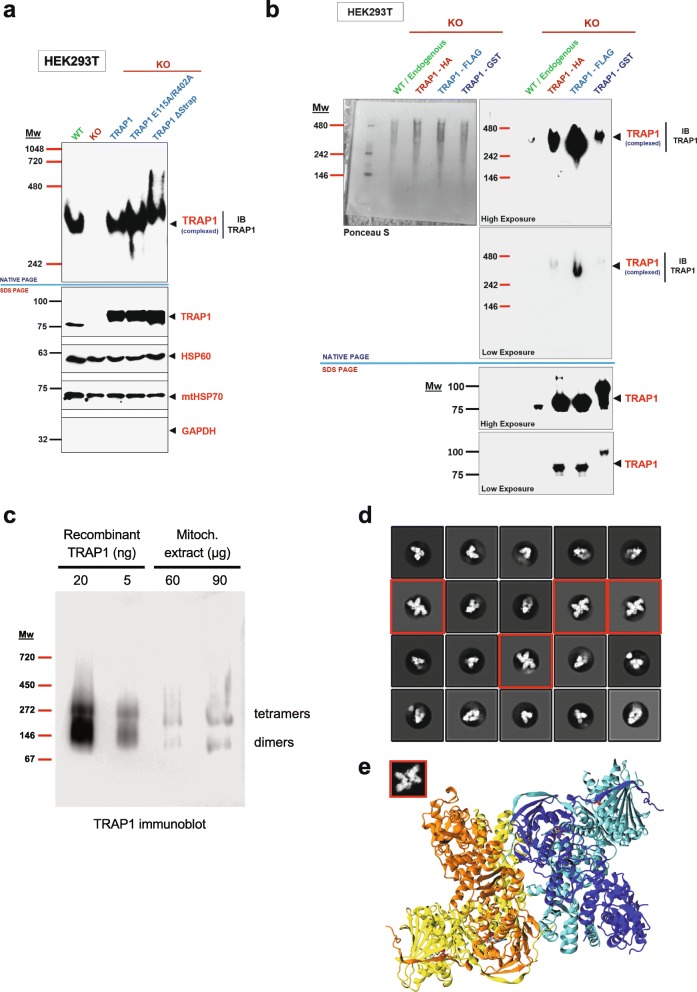
Fig. 5.
Analysis of the TRAP1 complex with native gels and cryo-EM. a Immunoblot of a native protein gel (NATIVE PAGE) showing TRAP1 complexes in mitochondrial extracts of WT versus KO HEK293T cells, and KO cells overexpressing WT TRAP1 or the TRAP1 mutants E115A/R402A or ΔStrap. Note that the ΔStrap mutant forms a slightly larger complex when compared to the others. The immunoblot was probed with a TRAP1 antibody. A parallel immunoblot was performed on the same samples under denaturing conditions (10% SDS PAGE) to check the expression levels of TRAP1. HSP60 and mtHSP70 were used as positive and GAPDH as negative controls to check the quality of the mitochondrial extracts. b Immunoblot of a native gel analysis to compare the complexes formed by wild-type (WT) endogenous TRAP1 and the indicated overexpressed tagged versions of TRAP1. Note that no TRAP1 dimer is detectable at steady state under any condition. All native gel immunoblots were probed with a TRAP1 antibody, and a parallel immunoblot under denaturing conditions (7.5% SDS PAGE) was also performed to check TRAP1 levels. HSP60 and GAPDH served as positive and negative controls, respectively, to check the quality of the mitochondrial extracts. c Immunoblot of a blue native protein gel (3–12%) comparing recombinant TRAP1 (20 and 5 ng) and endogenous TRAP1 in a mitochondrial extract (60 and 90 μg) from HEK293T cells. The positions of tetramers and dimers are indicated. Note that the markers used for clear and blue native gels are different (see the “Materials and methods” section) and that the Coomassie dye coating can differentially affect the migration of protein and protein complexes. d Representative cryo-EM reference-free 2D averaged classes of nucleotide-bound recombinant human TRAP1, showing both dimer and tetramer (red squares) populations. e Proposed 3D model for the TRAP1 tetramer in the nucleotide-bound closed state. Protomers in the first dimer are colored yellow and orange. Protomers in the second dimer are colored blue and cyan. The inset within the red square is a 2D projection of the proposed TRAP1 tetramer model with 10 Å low-pass filtering. The projection matched with the experimental 2D class average is highlighted in the red squares in b

