Fig. 6.
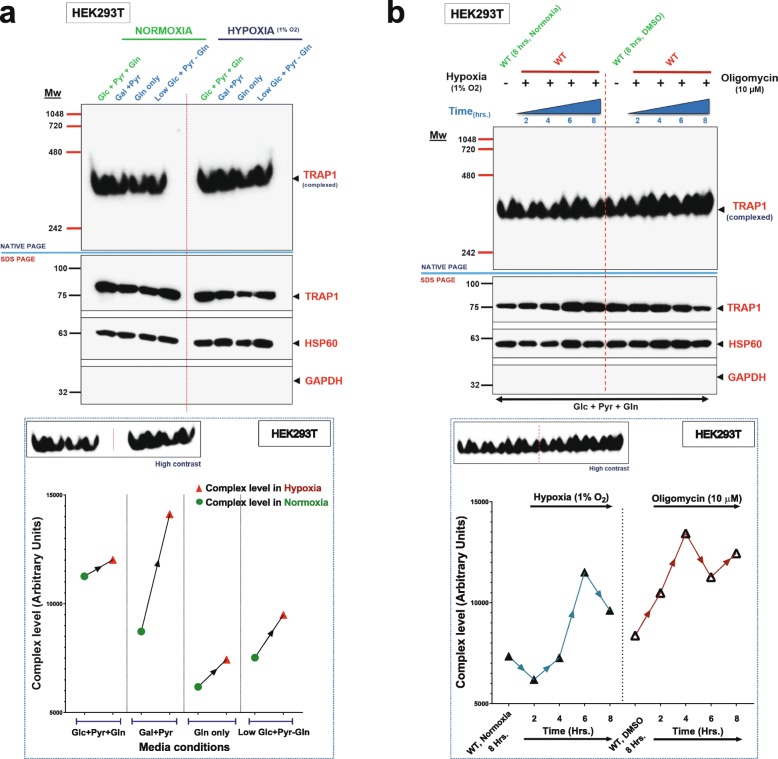
The TRAP1 complex is induced by OXPHOS inhibition. a Immunoblot of a native gel analysis of TRAP1 complexes from HEK293T cells grown with different carbon sources under normoxia or hypoxia (1% O2) overnight. Lower panel: graphical representation of the levels of the TRAP1 complex shown in the upper panels; band intensities were quantitated using ImageJ. b Immunoblot of a native gel analysis of TRAP1 complexes from cells subjected to hypoxia (1% O2) or an oligomycin (10 μM) treatment in parallel (in normoxia) for 2, 4, 6, and 8 h. The lower panel shows the quantitation. All quantitations with ImageJ shown are for a single native gel; similar results were obtained in three independent experiments

