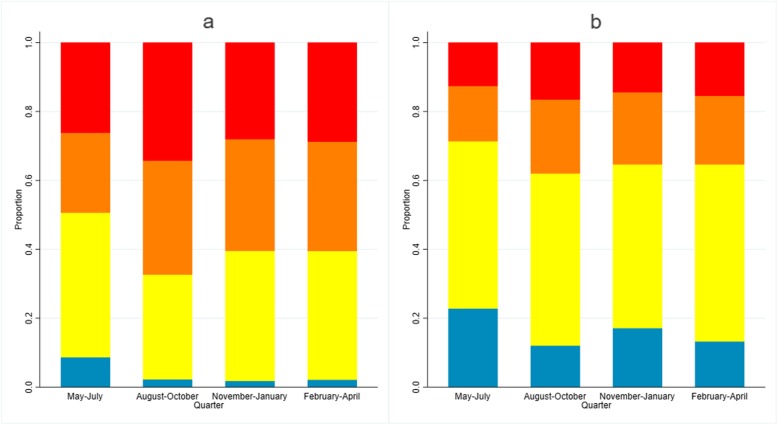
Fig. 2.
Proportion of individuals based on score of age-adjusted antibody responses to multiple a P. vivax and b P. falciparum antigens by survey time. Blue represents proportion of individuals with low age-adjusted antibody responses (score 1), yellow represents average (score 2), orange represents higher than average (score 3) and red represents proportion of individuals with highest age-adjusted antibody responses (score 4)

