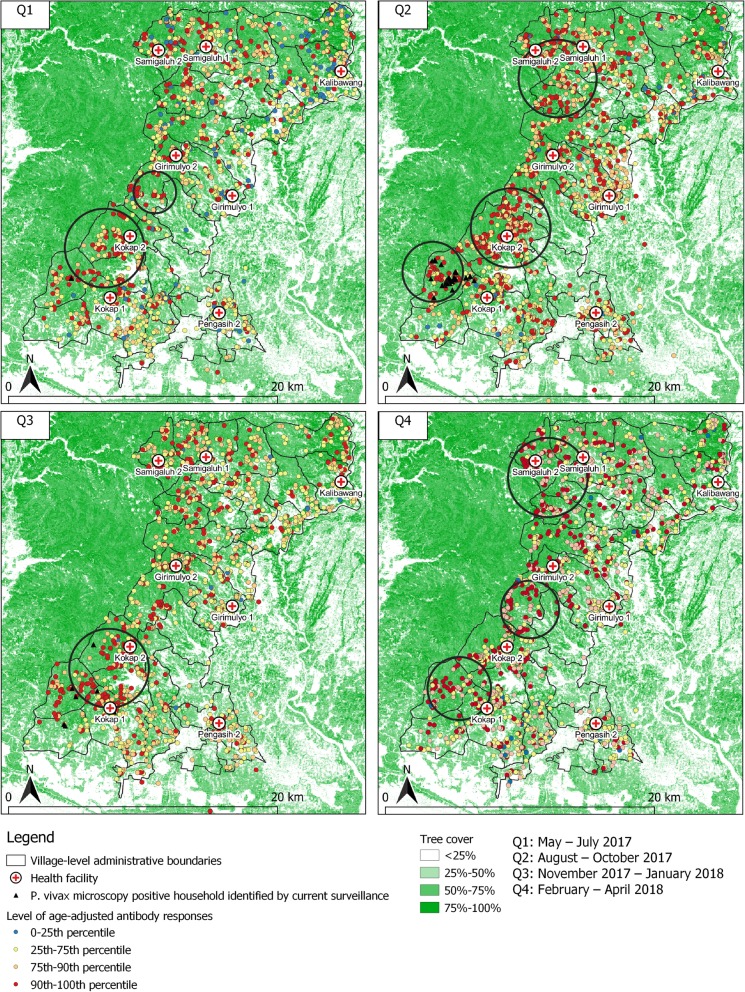
Fig. 5.
Spatial distribution of age-adjusted antibody responses to multiple P. vivax antigens over time of surveys overlaid with P. vivax microscopy infections captured by the current surveillance systems. Black triangles represent P. vivax microscopy-positive households. Black circle indicates a cluster of significantly higher than expected antibody responses detected using SaTScan (p value < 0.05)

