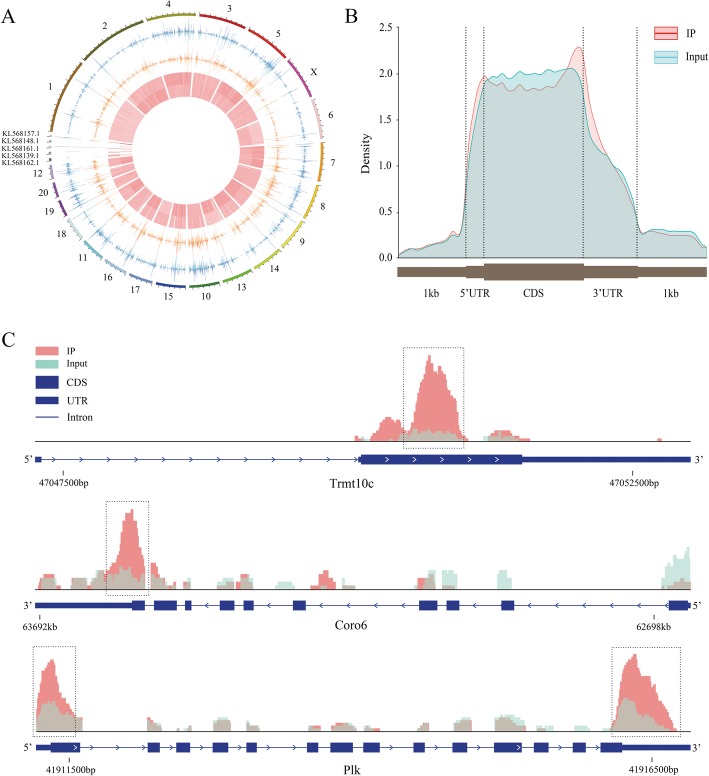
Fig. 2.
Topological distribution of m6A peaks. a, The distribution pattern of m6A peaks in different chromosomes. b, The distribution patterns of m6A methylation peaks in gene structures of mRNA. The peaks were mostly distributed on the exon region and there was a distinct enrichment peak at the 3′ terminate (near the stop codon) and an enrichment peak at the 5′ terminate (near the start codon). c, IGV plot shows directly the peaks in the genes of Trmt10c, Coro6 and Plk. The peak of Trmt10c was located at the CDS region, the peak of Coro7 was located at the CDS and 3′ UTR regions, and the peak of Plk was located at the 3′ UTR, the CDS, and the 5′ UTR regions

