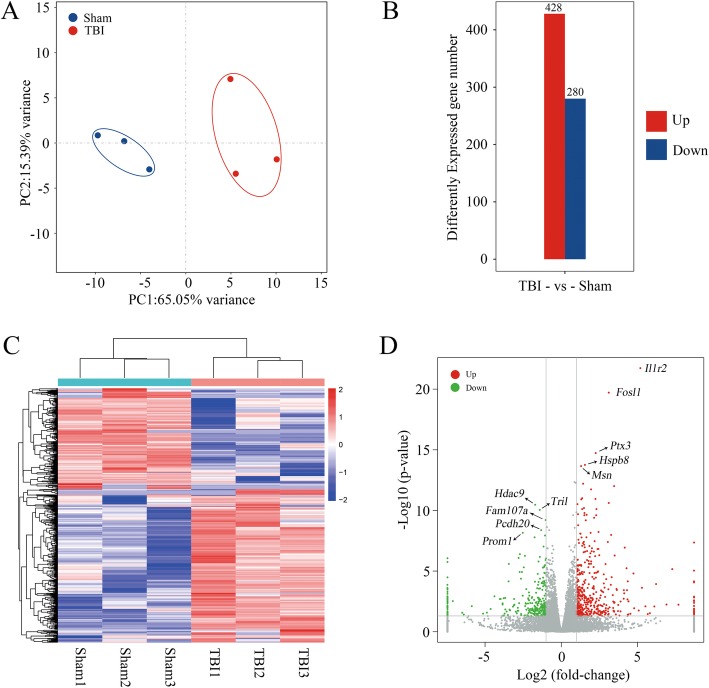
Fig. 7.
mRNA changes after traumatic brain injury. a, Principal component analysis of the TBI group and the sham group. The confidence ellipses of samples among sham and TBI groups were separate from each other. b, The expression level of mRNA post-TBI. A total of 428 mRNA expression increased and 280 mRNA expression decreased (p < 0.05, log2FC > 1) in rat cerebral cortex after TBI. c, Heat map shows the relative expression level of the three TBI IP and the three sham IP. d, Volcano plot shows the significantly up-regulated and down-regulated mRNA after TBI

