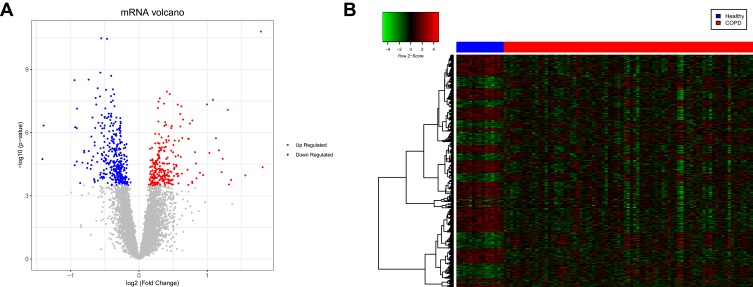
Figure 2.
Volcano plot and heatmap displaying the differentially expressed genes (DEGs). (A) Volcano plot of the DEGs. The red and blue dots represent the upregulated and downregulated genes, respectively. (B) Heatmap of the DEGs. The red and blue sample strips represent the chronic obstructive pulmonary disease (COPD) and healthy samples, respectively.

