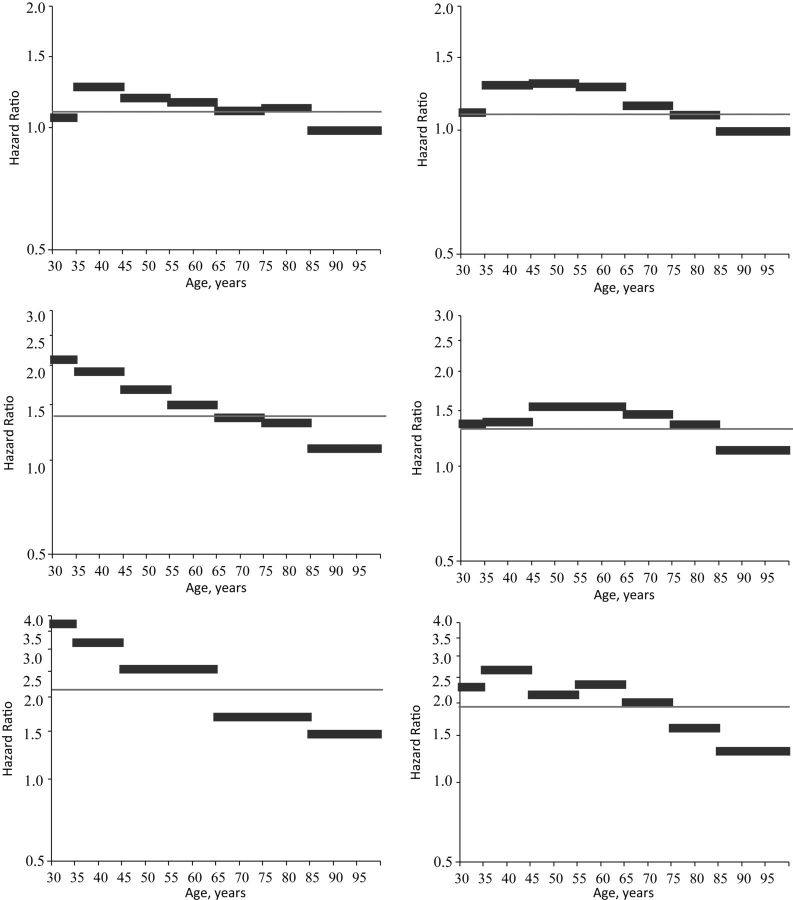
Figure 1.
Estimated mortality hazard ratios from models 1 (proportional) and 2 (grouped age coefficients) for obese persons (body mass index (BMI; weight (kg)/height (m)2) ≥30.0) versus normal-weight and overweight persons (BMI 18.5–29.9) in the United States, by sex, 1986–2006. Data were obtained from the National Health Interview Survey Linked Mortality Files. Models 1 and 2 were adjusted for educational attainment, income, marital status, and region of residence. The estimated proportional hazard ratio from model 1 is indicated by a gray line; the estimated age-specific hazard ratio from model 2 is indicated by black bars. Men's results are shown in column 1, women's results in column 2. Grade 1 obesity (BMI 30.0–34.9) is shown in row 1, grade 2 obesity (BMI 35.0–39.9) in row 2, and grade 3 obesity (BMI ≥40.0) in row 3.

