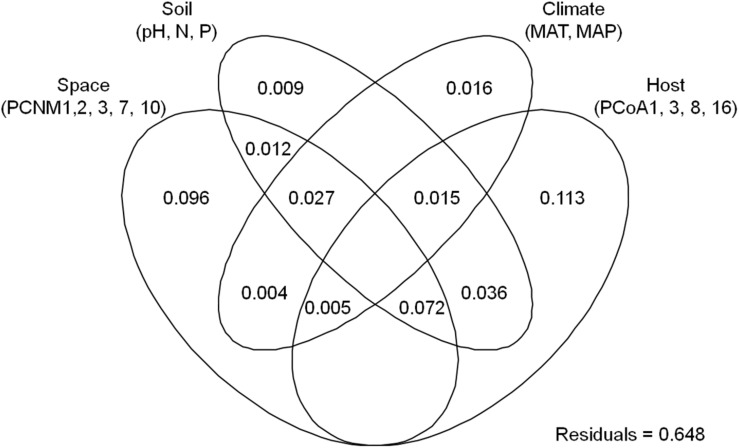
FIGURE 2.
Result of variation partitioning analysis showing pure and shared effects of plant, soil, climatic and spatial variables on endophytic fungal richness. Numbers indicate proportions of explained variation (adjusted R2 values). PCNM, spatial principal coordinates of neighbor matrices; PCoA, principal coordinates analysis of host phylogeny; N, soil total nitrogen; P, soil total phosphorus; MAT, mean annual temperature; MAP, mean annual precipitation.

