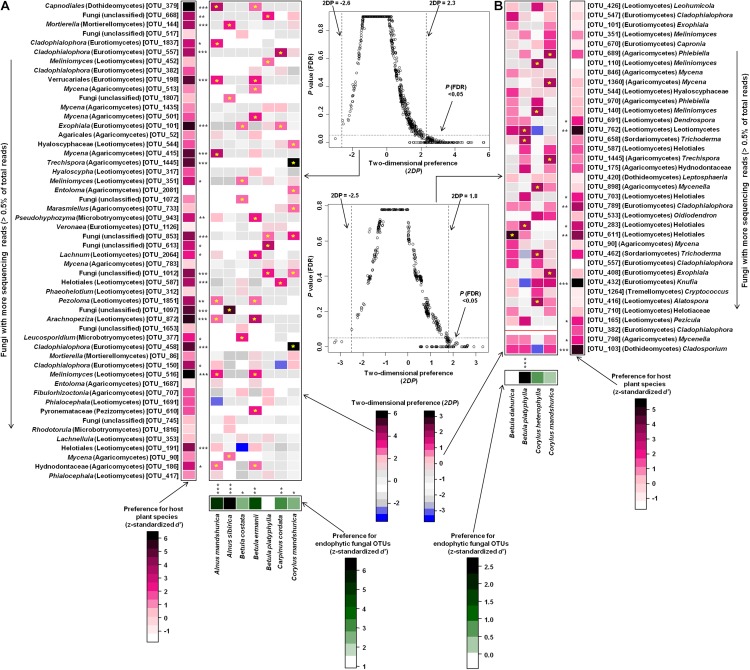
FIGURE 6.
Preferences observed in plant and endophytic fungus associations in Changbaishan (A) and Taiyueshan (B). Standardized d′ estimates of preferences for fungal OTUs for indicated plant species (columns). Likewise, the standardized d′ estimate of preferences for plant species is indicated for each of the observed fungal OTUs (row). A cell in the matrix indicates a two-dimensional preference (2DP) estimate, indicating the extent an association of a focal plant–fungus pair was observed more/less frequently than expected by chance. The cell with asterisk inside represents significant preferences in plant–fungus pair. The relationship between 2DP and FDR-adjusted P-values shows that 2DP values larger than 2.3 (Changbaishan) and 1.8 (Taiyueshan) and those smaller than –2.6 (Changbaishan) and –2.5 (Taiyueshan) represented strong preferences and avoidance, respectively. Red line indicates that the 2DP value is not available as the standard deviation of the number of samples for the focal plant–fungal OTU pair across randomized matrices is zero. Because multiple species/OTUs were tested, the P values are shown as false discovery rates (FDRs) in the plant/fungus analysis. ∗P < 0.05, ∗∗P < 0.01, ∗∗∗P < 0.001.

