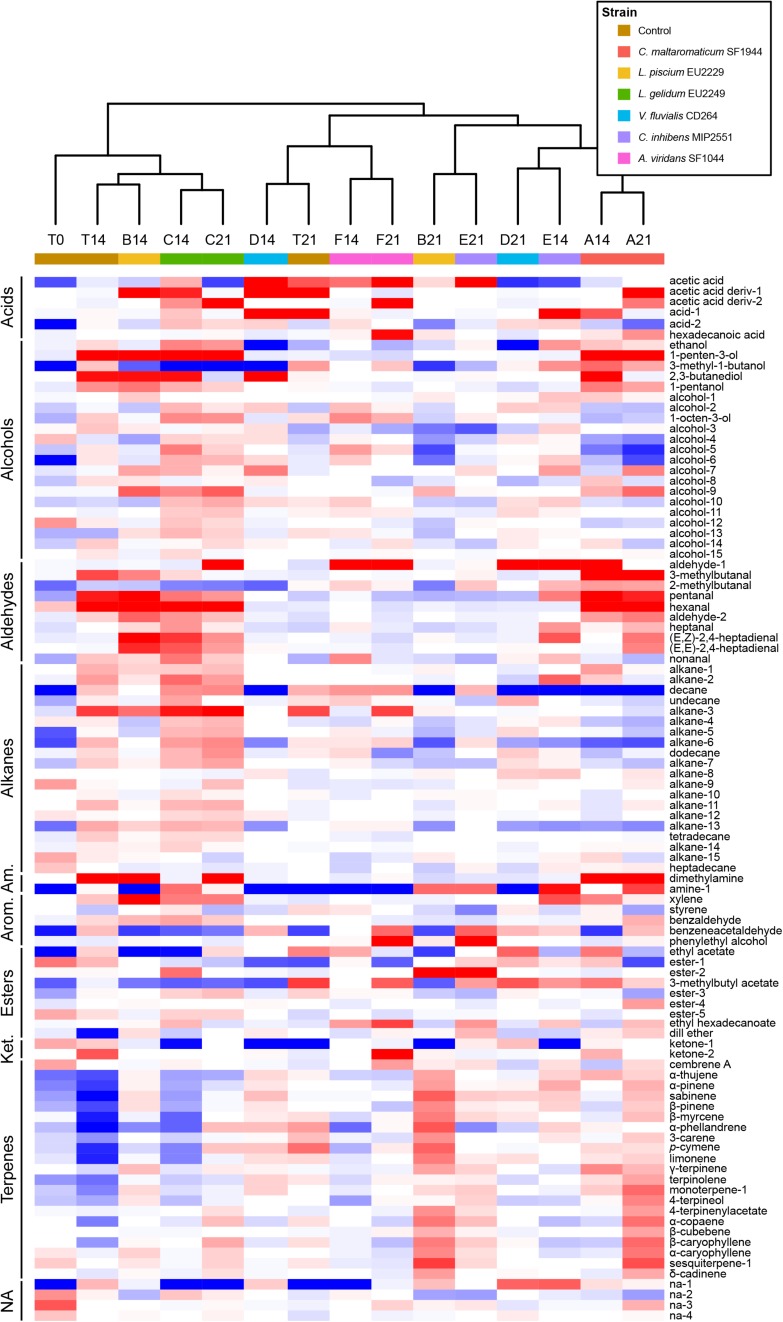
FIGURE 11.
Hierarchical cluster analysis (HCA) heatmap of control and protective culture volatilome composition, based on Pearson correlation calculated from log2(n) transformation of the median based ratio on VOCs mean concentrations (n = 3). Bluish colors indicate lower metabolite concentrations, reddish colors show higher metabolite level. Am, Amines; Arom, Aromatics; Ket, Ketones.; NA, Not identified. A: C. maltaromaticum SF1944, B: L. piscium EU2229, C: L. gelidum EU2249, D: V. fluvialis CD264, E: C. inhibens MIP2551, F: A. viridans SF1044 and T: Control. Numbers following letters refer to the sampling time. See Supplementary Data 3.

