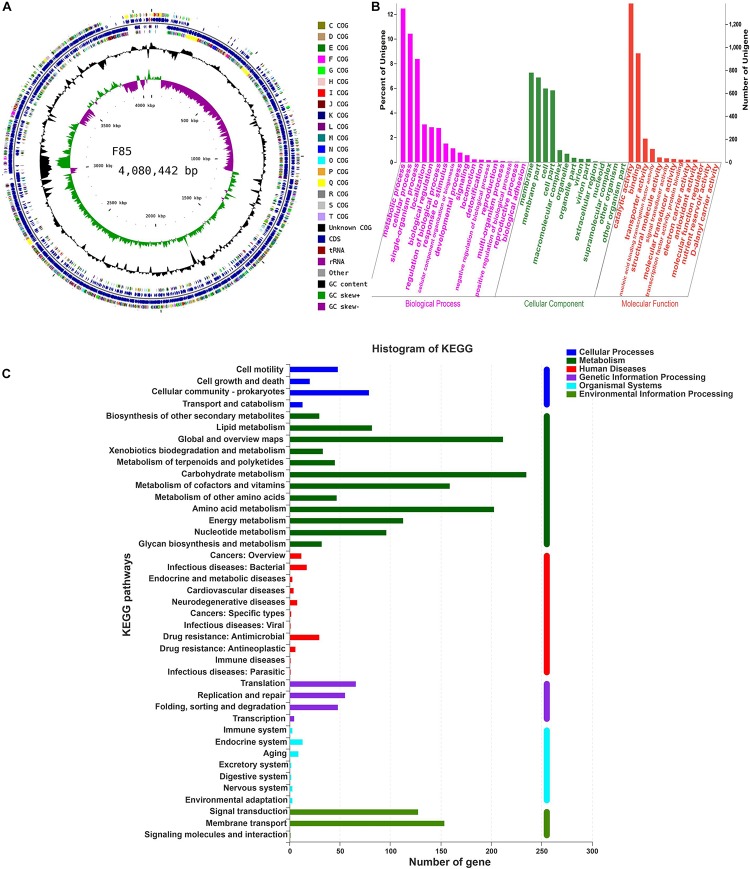
FIGURE 7.
Circular genome visualization, and GO annotation and KEGG pathway analysis of F85. (A) Circular representation of the F85 genome. From outside to inside, circle 1: scale; circles 2 and 3: predicted CDSs color-coded according to their functions; circle 4: rRNA and tRNA; circle 5: GC content; circle 6: GC skew (G+C/G-C). (B) GO annotation of F85, mainly including three major categories: ‘biological processes,’ ‘cellular component,’ and ‘molecular function.’ (C) KEGG pathway analysis of F85. KEGG pathway can be divided into seven categories: Metabolism, Genetic Information Processing, Environmental Information Processing, Cellular Processes, Organismal Systems, Human Diseases, and Drug Development.

