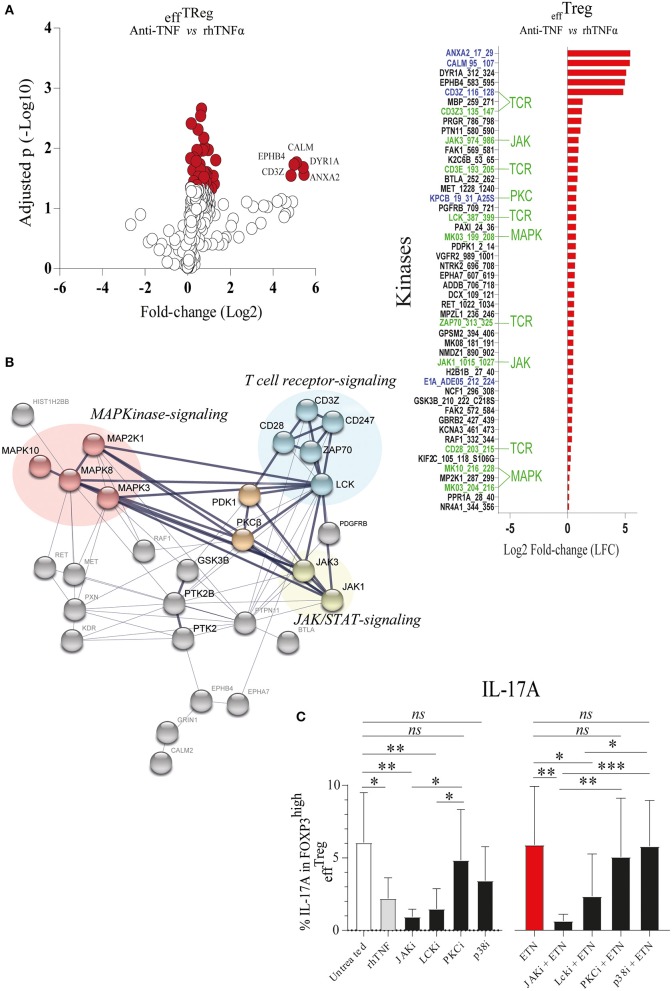
Figure 3.
TNFα signaling in effTreg suppresses TCR and JAK kinase activity, leading to regulation of IL-17A expression. effTreg were stimulated with αCD3/CD28 beads and rh-IL-2 in the presence of rhTNFα or anti-TNF. On day 4, phosphoserine/threonine kinase (STK) and phosphotyrosine kinase (PTK) activity of cells were Analyzed using a kinome activity array. (A) Left panel: Volcano plot showing the fold change in kinase activity and adjusted p-values (red symbols, p < 0.05; n = 4) in STK and PTK kinase activity. Right panel: Fold change in the kinases identified by comparing anti-TNF with rhTNFα conditions. Of note, TNFα was used as reference to calculate the fold change. Green texts indicate unique kinases that show increased activity upon comparison of anti-TNF to rhTNFα conditions; Blue texts represent kinases with enhanced activity upon comparison of comparing anti-TNF to the control (αCD3/CD28 stimulated without rhTNF or anti-TNF). (B) Cumulative STRING© protein network analysis based on the identified kinases listed in (A). (C) Flow cytometry of intracellular IL-17A expression in FOXP3high effTreg. Pathway inhibition validation assays applying small chemical molecules in the stimulation assay as described above (mean ± SEM, n = 7). JAKi, JAK inhibitor (tofacitinib); Lcki, Lck inhibitor (A420983); PKCi, PKC inhibitor (AEB071); and p38i, p38MAPK inhibitor (UR13870). ANOVA Dunnett's testing (A) and Friedman test followed by Dunn's multiple comparisons test (C) were used. *p < 0.05, **p < 0.001, ***p 0.0001, ns, not significant.

